Product Images Rivastigmine Tartrate

View Photos of Packaging, Labels & Appearance

Product Label Images

The following 13 images provide visual information about the product associated with Rivastigmine Tartrate NDC 62332-064 by Alembic Pharmaceuticals Inc., such as packaging, labeling, and the appearance of the drug itself. This resource could be helpful for medical professionals, pharmacists, and patients seeking to verify medication information and ensure they have the correct product.

30 capsules - rivastigmine 1 5mg 30 bottle

30 capsules - rivastigmine 1 5mg 30 bottle

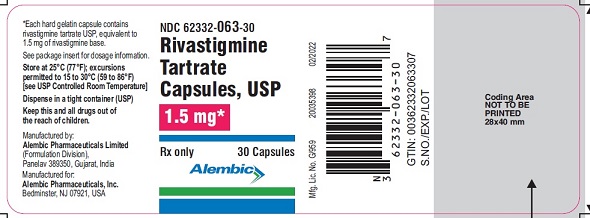
Rivastigmine Tartrate Capsules are available in a 30 capsule pack. The NDC number for these capsules is 62332-063-30 and the GTIN number is 00362332063307. There are some unclear and non-English characters in the text.*

30 capsules - rivastigmine 3mg 30 bottle

30 capsules - rivastigmine 3mg 30 bottle

30 capsules - rivastigmine 4 5mg 30 bottle

30 capsules - rivastigmine 4 5mg 30 bottle

30 capsules - rivastigmine 6mg 30 bottle

30 capsules - rivastigmine 6mg 30 bottle

Figure 1 - rivastigmine fig1

Figure 1 - rivastigmine fig1

Figure 2 - rivastigmine fig2

Figure 2 - rivastigmine fig2

Figure 3 - rivastigmine fig3

Figure 3 - rivastigmine fig3

Figure 4 - rivastigmine fig4

Figure 4 - rivastigmine fig4

This is a table or graph presenting the mean (+/- SEM) change from baseline in AADAS-cog rating during treatment over a period of 26 weeks. It seems to be related to clinical improvement or decline.*

Figure 5 - rivastigmine fig5

Figure 5 - rivastigmine fig5

The information provided seems to be a chart or graph that shows the cumulative percentage of patients in different treatment groups and the change in ADAS-cog scores from baseline. The treatment groups are labeled as TeamentGrop, Placebo, t-4mgly, and 612mgidy. The chart also shows the change in ADAS-cog scores at different levels, ranging from -20 to +25. It is not clear what this chart represents without further context.*

Figure 6 - rivastigmine fig6

Figure 6 - rivastigmine fig6

The text represents a chart or graph showing the percentage of patients and their improvement level with different dosages of a drug compared to placebo using CIBIC-Plus rating as a measure. The dosages vary from 0 to 12 mg, and the improvement level ranges from markedly worse to markedly improved.*

Figure 8 - rivastigmine fig8

Figure 8 - rivastigmine fig8

Figure 7 - rivastigmine figure7

Figure 7 - rivastigmine figure7

Structure - rivastigmine structure

Structure - rivastigmine structure

* The product label images have been analyzed using a combination of traditional computing and machine learning techniques. It should be noted that the descriptions provided may not be entirely accurate as they are experimental in nature. Use the information in this page at your own discretion and risk.