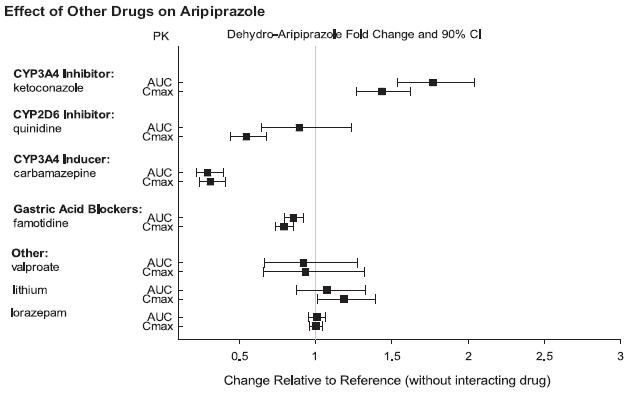
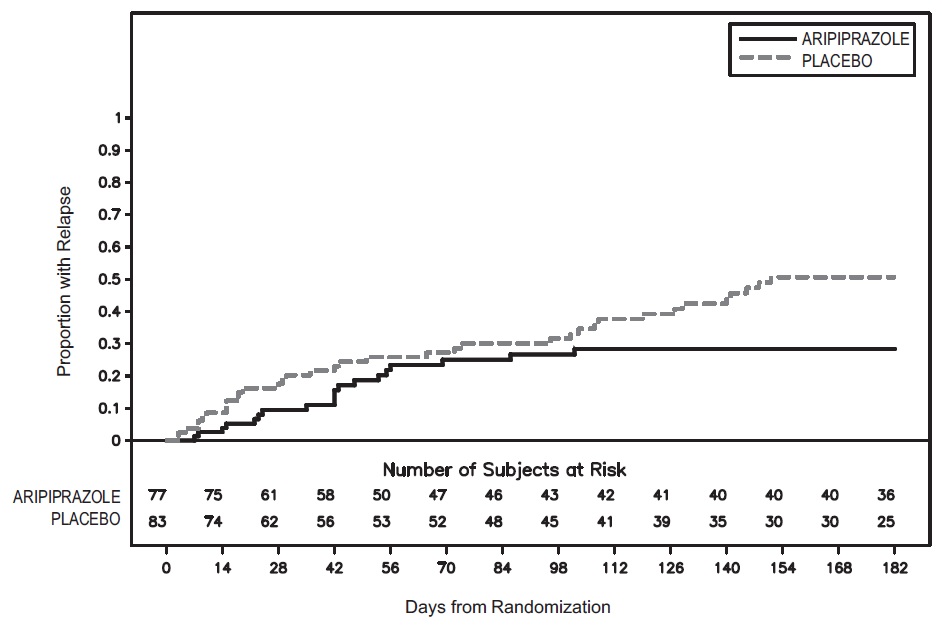
Figure 1 (Aripiprazole 1figure)

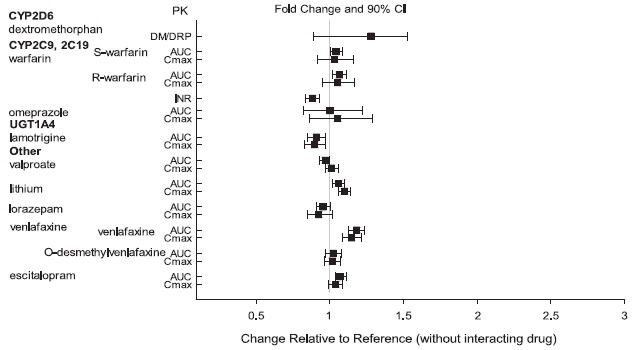
This is a table that shows the effect of different drugs on aripiprazole, a medication used for treating symptoms of schizophrenia and bipolar disorder. The drugs included in the table are categorized according to their interaction with specific enzymes involved in the metabolism of aripiprazole. The table displays changes in the amount of aripiprazole (reported as fold change) relative to a reference value (without interacting drug). Additionally, the table reports the maximum concentration of some of the interacting drugs in the blood (Cmax). The drugs listed include ketoconazole, sunitinib, carbamazepine, and famotidine, among others.*