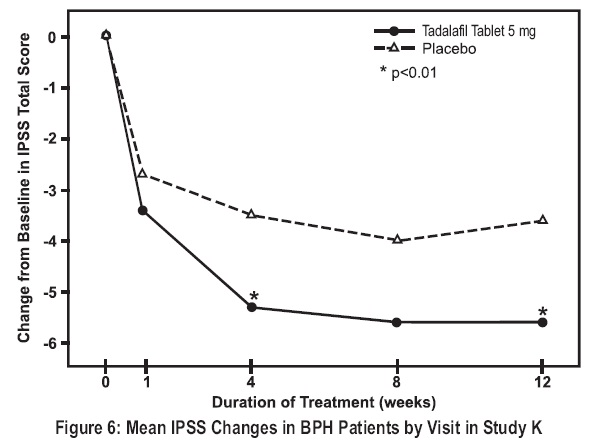
Tadalafil Tablet, Coated
Product Images NDC 62332-178
View Photos of Packaging, Regulatory Labels, and Product Appearance
Product Visual Gallery
This gallery contains 13 technical images submitted to the FDA as part of the official labeling for Tadalafil (NDC 62332-178). Unlike standard consumer photos, these assets often include clinical data figures, molecular chemical structures, and official manufacturer packaging layouts.
As provided by Alembic Pharmaceuticals Inc., these visuals offer a comprehensive scientific overview of the product's physical and chemical identity, aiding pharmacists and researchers in product verification and study.
Product Images & Figures Index
Figure 6 (Tadalafil 6figure)
This appears to be a graph or chart displaying the change from baseline in IPSS (International Prostate Symptom Score) total score in BPH (Benign Prostatic Hyperplasia) patients treated with Tadalafil Tablet 5 mg over a duration of 12 weeks. The X-axis represents the duration of treatment in weeks, and the Y-axis represents the mean IPSS changes at each visit. However, without the actual graph or chart, it is difficult to provide a more detailed description.*
Figure 7 (Tadalafil 7figure)
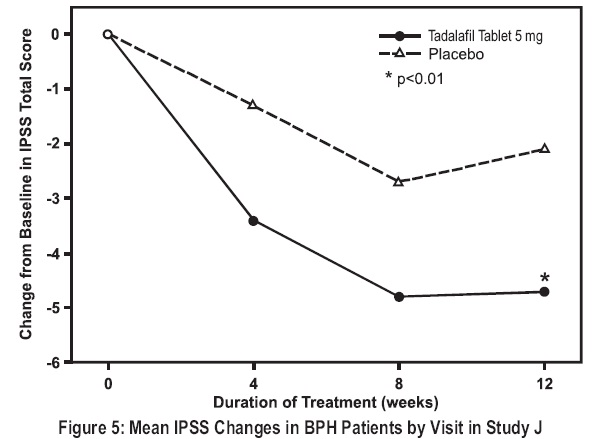
The text describes a graph showing the mean total IPSS changes by visit in BPH patients taking Tadalafil Tablet with Finasteride. The x-axis in the graph represents the number of weeks of therapy, while the y-axis represents the least-squares treatment difference and the LS mean change from baseline. There are two groups being compared, Tadalafil/Finasteride and Placebo/Finasteride. The text also indicates that there is statistical significance (p<0.05) in the LS mean change from baseline for the Tadalafil/Finasteride group compared to the Placebo/Finasteride group.*
Figure 8 (Tadalafil 8figure)
The text describes a chart showing the change in IPSS total score in ED/BPH patients using Tadalafil Tablet 5mg and placebo over a period of 12 weeks. The chart shows that there is a significant difference in IPSS total score between the two groups (p<0.01). The text indicates that the chart is from "Study L".*
Figure 1 (Tadalafil Figure1)
Figure 2 (Tadalafil Figure2)
Figure 3 (Tadalafil Figure3)
Figure 4 (Tadalafil Figure4)
This is a graph that shows the concentration of Tadalafil in plasma in micrograms per liter (ug/L) at different time intervals (in hours) after the administration of different doses. The graph compares the concentrations achieved by a single 20-mg Tadalafil dose, a single 5-mg Tadalafil dose, and a once-daily 5-mg Tadalafil dose after five consecutive days of administration.*
Tadalafil mg5
Product description: This text consists of information about a medication named "oo smarwens Tafalafil Tablets, USP" with the National Drug Code (NDC) 62332-178-30. The format of the information appears to be a label or packaging of the medication. There is also a code on the label, GTIN: 0362332178308, and information related to the manufacturer, "Pramac il Lintad". There is no further useful information in this text.*
Tadalafil Strength10
Tadalafil Strength20
Tadalafil Strength25mg
Structure (Tadalafil Structure)
* These product label images have been analyzed using experimental machine learning. Please verify findings with the primary label text.