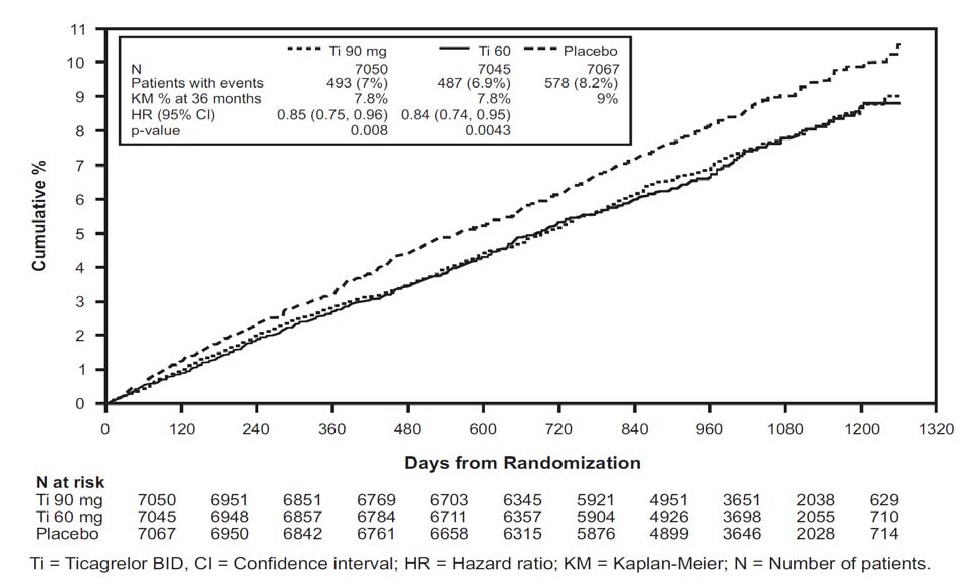
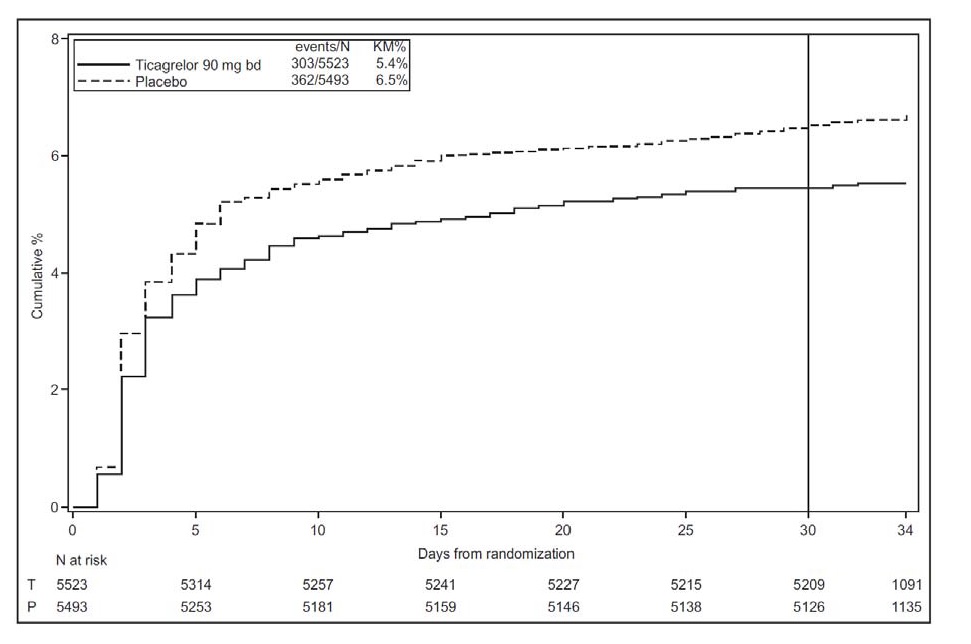
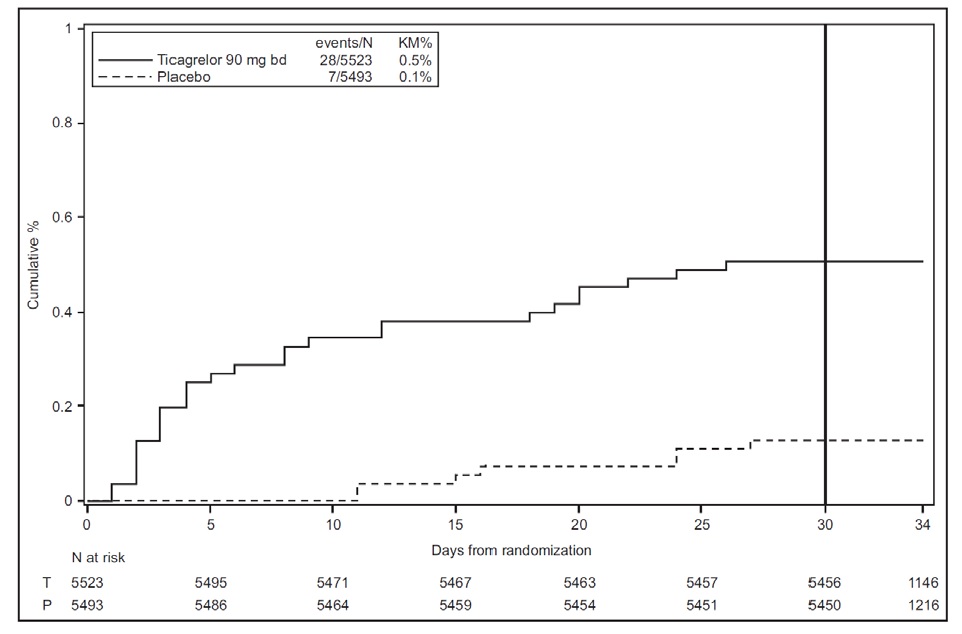
Product Images Ticagrelor

View Photos of Packaging, Labels & Appearance

Product Label Images

The following 20 images provide visual information about the product associated with Ticagrelor NDC 62332-241 by Alembic Pharmaceuticals Inc., such as packaging, labeling, and the appearance of the drug itself. This resource could be helpful for medical professionals, pharmacists, and patients seeking to verify medication information and ensure they have the correct product.

figure 10 - ticagrelor 10figure

figure 10 - ticagrelor 10figure

This text appears to be a statistical analysis comparing events and outcomes between two groups of patients (Ti9omg and Clopidogrel) over 12 months. The data includes percentages of events at 12 months, Hazard Ratio (HR) with confidence interval, and p-values. The timeline spans 360 days with the number of patients at risk for each time point.*

figure 11 - ticagrelor 11figure

figure 11 - ticagrelor 11figure

This text provides detailed information on the characteristics of a clinical trial, including treatment effects, patient demographics, and treatment approaches. It includes data on geographic distribution, medication usage, and outcomes related to different variables such as age group, sex, and race. The text also presents statistical analysis results comparing the efficacy of Ticagrelor and Clopidogrel in the study population.*

figure 12 - ticagrelor 12figure

figure 12 - ticagrelor 12figure

figure 13 - ticagrelor 13figure

figure 13 - ticagrelor 13figure

This is a description of a clinical trial comparing the efficacy of different doses of a medication (Ticagrelor) versus a placebo in reducing events over time. The data includes the number of patients at risk, number of patients experiencing events, Kaplan-Meier percentage at 36 months, hazard ratios with confidence intervals, and p-values. The study tracked patients over 3 years and presents data on the medication's effect on patient outcomes.*

figure 14 - ticagrelor 14figure

figure 14 - ticagrelor 14figure

This text appears to be a detailed table providing information on characteristics and treatment outcomes related to a medical study. It includes data on different variables such as age group, sex, race, weight group, BMI, geographic region, medical history, and treatment outcomes for Ticagrelor and Placebo in relation to different parameters. The table also shows hazard ratios and confidence intervals for the treatment effect.*

figure 15 - ticagrelor 15figure

figure 15 - ticagrelor 15figure

This text provides information on a clinical trial comparing Ticagrelor and Placebo over a span of 54 months from randomization. It presents the number of patients at risk for each treatment group at various time-points during the trial. Ticagrelor was administered to 9619 patients and Placebo to 9601 patients. The text includes a table with the number of patients at risk for each treatment group at different time intervals post-randomization.*

figure 16 - ticagrelor 16figure

figure 16 - ticagrelor 16figure

This captured data represents characteristics and outcomes of a study comparing Ticagrelor and Placebo in a clinical trial. The text includes information on different variables such as age, gender, race, body mass index, geographic region, aspirin dose, HbA1c levels, kidney function, medical history (angina, PCI, stent placement, CABG), smoking status, time since procedures, and duration of diabetes. The data shows hazard ratios with 95% confidence intervals for Ticagrelor and Placebo in relation to different subgroups. The study found that in some cases, Ticagrelor was better than Placebo based on the analyzed outcomes.*

figure 17 - ticagrelor 17figur

figure 17 - ticagrelor 17figur

figure 18 - ticagrelor 18figur

figure 18 - ticagrelor 18figur

The provided text contains data related to a clinical trial comparing the effects of Ticagrelor and Placebo on various characteristics such as age, sex, race, weight, BMI, geographic region, diagnosis of index event, time from index event to randomization, presence of diabetes mellitus, hypertension, prior stroke or TIA, ischemic heart disease, prior ASA use, statin treatment, and smoking status. The data is presented in terms of Hazard Ratios (HR) with 95% Confidence Intervals (CI) for each characteristic. The information provided can be used to analyze the impact of Ticagrelor compared to Placebo on different subgroups within the study population.*

figure 1 - ticagrelor 1figure

figure 1 - ticagrelor 1figure

figure 2 - ticagrelor 2figure

figure 2 - ticagrelor 2figure

figure 3 - ticagrelor 3figure

figure 3 - ticagrelor 3figure

This text provides data on the number of patients in a study comparing the drug Ticagrelor to a placebo. The data includes the cumulative percentage over time, represented in months from randomization. The number of patients at risk for each group is also shown.*

figure 4 - ticagrelor 4figure

figure 4 - ticagrelor 4figure

This is an evaluation of cumulative percentages of events for Ticagrelor 90mg bd and Placebo over a specified number of days from randomization. The data shows the number of events for each treatment group at different time points. Ticagrelor had a cumulative percentage of 0.5% with 28 events out of 5523, while Placebo had a cumulative percentage of 0.1% with 7 events out of 5493.*

figure 5 - ticagrelor 5figure

figure 5 - ticagrelor 5figure

figure 6 - ticagrelor 6figure

figure 6 - ticagrelor 6figure

This is a data table showing the IPA (%) induced by 20μM ADP over a period of 10 days for ticagrelor, clopidogrel, and placebo. Ticagrelor showed an IPA of 100% on the 4th day, while clopidogrel and placebo data are not provided explicitly.*

figure 7 - ticagrelor 7figure

figure 7 - ticagrelor 7figure

This is a data table presenting the mean effect and 90% confidence interval for the impact of intrinsic factors on Ticagrelor AR-G124910XX recommendation. It includes information on recommendations for age, gender, ethnicity, renal impairment, end-stage renal disease on hemodialysis, and hepatic impairment. The table specifies that Ticagrelor has not been studied in patients with moderate or severe hepatic impairment.*

figure 8 - ticagrelor 8fig

figure 8 - ticagrelor 8fig

figure 9 - ticagrelor figure 9

figure 9 - ticagrelor figure 9

This text provides information on the interacting drugs and their mean effects with Ticagrelor doses. It includes recommendations for various combinations such as Simvastatin, Atorvastatin, Levonorgestrel, Ethinyl Estradiol, Tolbutamide, Digoxin, and Cyclosporine with Ticagrelor. Additionally, it states if any dose adjustments are needed for each combination.*

structure - ticagrelor structure

structure - ticagrelor structure

30 tablets - ticagrelor tabs 90 mg

30 tablets - ticagrelor tabs 90 mg

* The product label images have been analyzed using a combination of traditional computing and machine learning techniques. It should be noted that the descriptions provided may not be entirely accurate as they are experimental in nature. Use the information in this page at your own discretion and risk.