Silodosin Capsule
Product Images NDC 62332-405

View Photos of Packaging, Regulatory Labels, and Product Appearance

Product Visual Gallery

This gallery contains 8 technical images submitted to the FDA as part of the official labeling for Silodosin (NDC 62332-405). Unlike standard consumer photos, these assets often include clinical data figures, molecular chemical structures, and official manufacturer packaging layouts.

As provided by Alembic Pharmaceuticals Inc., these visuals offer a comprehensive scientific overview of the product's physical and chemical identity, aiding pharmacists and researchers in product verification and study.

FDA Label Image

30 Capsues In 1 Bottle (Silodosin 4mg)

30 Capsues In 1 Bottle (Silodosin 4mg)
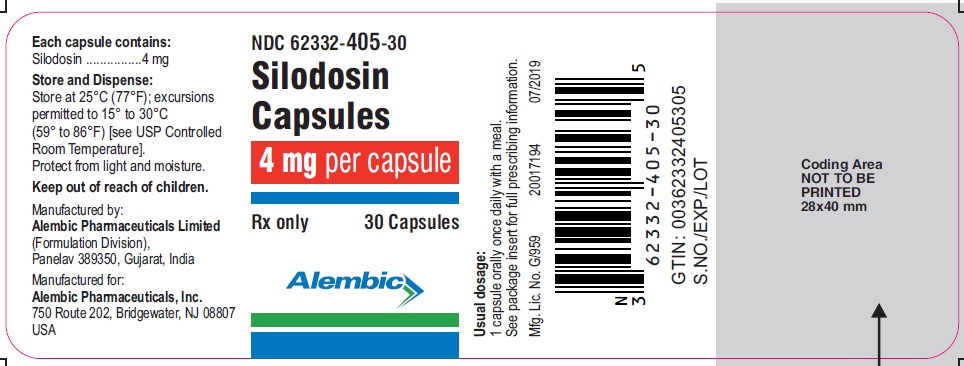
This is a description of a prescription drug called Silodosin, which comes in a capsule form with 4mg of dosage. Each capsule is to be orally taken once daily with a meal. It is manufactured by Alembic Pharmaceuticals Limited in Gujarat, India, and distributed by Alembic Pharmaceuticals, Inc. in the USA. The capsules should be stored at 25°C (77°F), and protected from light and moisture. The package insert provides prescribing information, and it has a GTIN code of 00362332405305.*
FDA Label Image

30 Capsules (Silodosin 8mg)

FDA Label Image

Figure 1 (Silodosin Figur1)

FDA Label Image

Figure 2 (Silodosin Figur2)

Figure 2 (Silodosin Figur2)
The text describes a study analyzing the change from baseline (pre-treatment) in IPSS total score. The results indicate statistical significance (p<0.0001) and involve variables such as Aries Placebo and Silodosin Capsules 8 mg. However, without more context, it is unclear what the IPSS total score represents or the purpose of the study.*
FDA Label Image

Figure 3 (Silodosin Figur3)

Figure 3 (Silodosin Figur3)
The text is reporting data on the change from baseline in IPSS total score for a clinical trial with a placebo group and a group that received Silodosin Capsules 8 mg. The notation ** p<0.0001 suggests that there was a statistically significant difference between the two groups. The data is shown graphically in a table indicating the score for each group at Day 28 and Day 84/LOCF.*
FDA Label Image

Figure 4 (Silodosin Figur4)

Figure 4 (Silodosin Figur4)
The text represents a table showing changes in maximum flow rate (Qmax) for a medication called Silodosin Capsules 8 mg compared to a placebo. The asterisk denotes a statistically significant difference (p<0.05) from the placebo group. The values in the table represent the change from baseline Qmax in mL/sec. The last row shows the day of measurement.*
FDA Label Image

Figure 5 (Silodosin Figur5)

Figure 5 (Silodosin Figur5)
The text describes a graph or chart displaying changes from a baseline in Qmax (maximum urine flow rate in mL per second) over time (in days). The data includes two sets of values, one for a placebo group and one for a group taking Silodosin Capsules 8 mg. The asterisk and "p<0.05" indicate a statistically significant difference between the two groups at some point in time (not specified). The legend provides information about the time intervals measured (-1 to 84 days) and the method of analysis used (last observation carried forward, or LOCF).*
FDA Label Image

Structure (Silodosin Structure)

* These product label images have been analyzed using experimental machine learning. Please verify findings with the primary label text.