Pirfenidone Tablet, Coated
Product Images NDC 62332-479

View Photos of Packaging, Regulatory Labels, and Product Appearance

Product Visual Gallery

This gallery contains 6 technical images submitted to the FDA as part of the official labeling for Pirfenidone (NDC 62332-479). Unlike standard consumer photos, these assets often include clinical data figures, molecular chemical structures, and official manufacturer packaging layouts.

As provided by Alembic Pharmaceuticals Inc., these visuals offer a comprehensive scientific overview of the product's physical and chemical identity, aiding pharmacists and researchers in product verification and study.

FDA Label Image

500 Tablets (Pirfenidone 267 mg)

500 Tablets (Pirfenidone 267 mg)
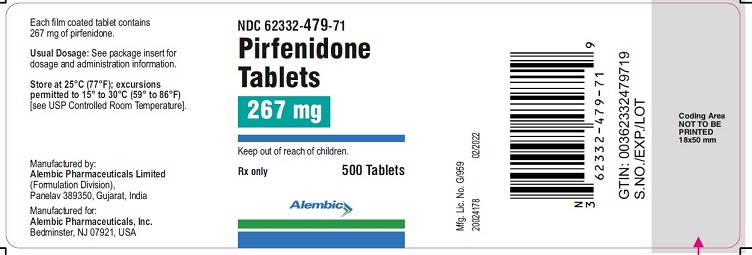
Each tablet of Pirfenidone contains 267 mg. It is recommended to use the dosage and administration instructions from the package. The tablets should be stored at a temperature of 25°C with excursions permitted to 15°C to 50°C. Pirfenidone is manufactured by Alembic Pharmaceuticals in the United States. The product should be kept away from children. The tablet's GTIN number is 00362332479719. Other than this, no useful information is available due to errors in the text.*
FDA Label Image

500 Tablets (Pirfenidone 801 mg)

500 Tablets (Pirfenidone 801 mg)
This seems to be a label on a bottle of Pirfenidone tablets, with details such as the quantity (801 mg) and the number of tablets (500). It also includes the GTIN (Global Trade Item Number) for the product. There is not enough readable information to provide more details.*
FDA Label Image

Figure 1 (Pirfenidone Figure1)

FDA Label Image

Figure 2 (Pirfenidone Figure2)

Figure 2 (Pirfenidone Figure2)
This text describes a graph that shows the mean change in Forced Vital Capacity (FVC) in milliliters (mL) over a period of 52 weeks. The study compares the effects of Pijrfenidone (n=278) and a placebo (n=277) on FVC in patients. The horizontal axis represents the time in weeks, and the vertical axis represents the change in FVC in mL. The graph shows that there was a greater decrease in FVC in the placebo group compared to the Pijrfenidone group.*
FDA Label Image

Figure 3 (Pirfenidone Figure3)

Figure 3 (Pirfenidone Figure3)
This is a statistical chart showing the Percentage of Patients Alive over time, with Pirfenidone on one side and Placebo on the other. The data displays how many patients remained alive over the course of 120 weeks of treatment, with the Pirfenidone group showing a slightly higher survival rate than the Placebo group. The risk rate of each group is also depicted for each week.*
FDA Label Image

Pirfenidone (Pirfenidone Structure)

* These product label images have been analyzed using experimental machine learning. Please verify findings with the primary label text.