Fulvestrant Injection
Product Images NDC 62332-650

View Photos of Packaging, Regulatory Labels, and Product Appearance

Product Visual Gallery

This gallery contains 17 technical images submitted to the FDA as part of the official labeling for Fulvestrant (NDC 62332-650). Unlike standard consumer photos, these assets often include clinical data figures, molecular chemical structures, and official manufacturer packaging layouts.

As provided by Alembic Pharmaceuticals Inc., these visuals offer a comprehensive scientific overview of the product's physical and chemical identity, aiding pharmacists and researchers in product verification and study.

FDA Label Image

Fulvestrant-carton-label (Fulvestrant Carton Label)

Fulvestrant-carton-label (Fulvestrant Carton Label)
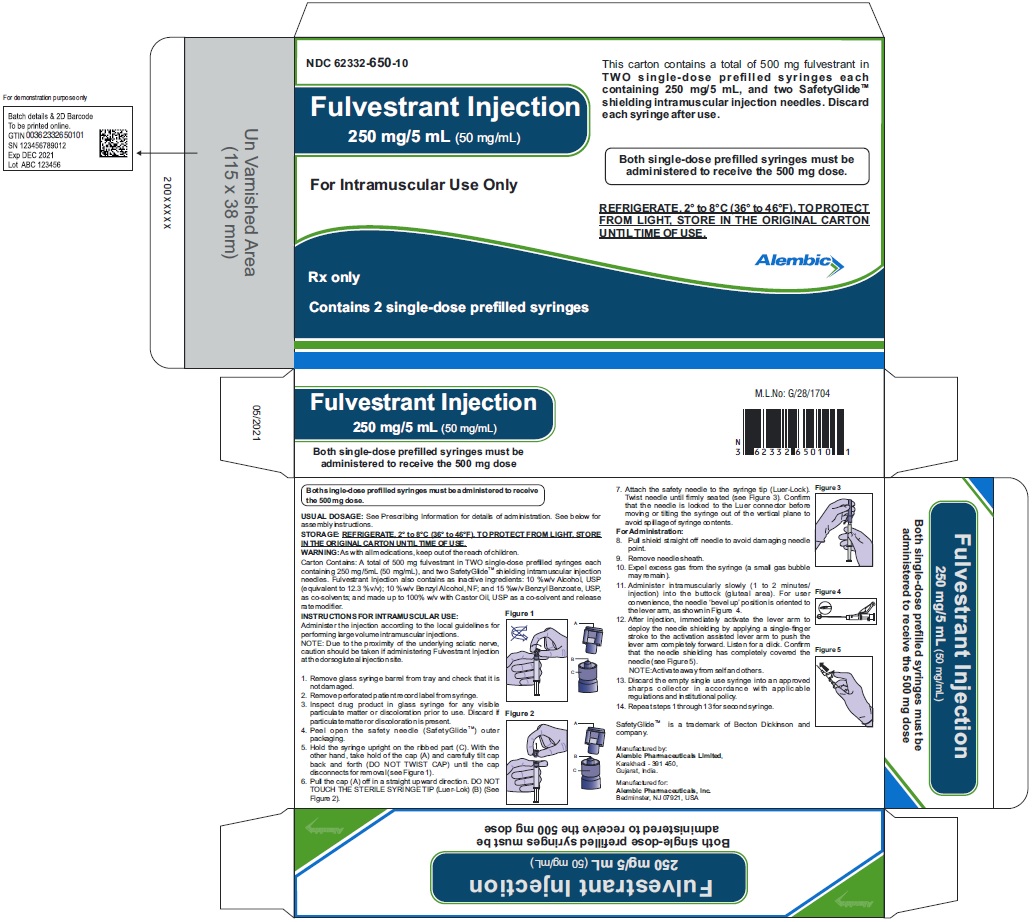
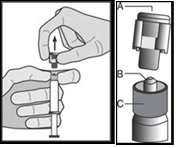
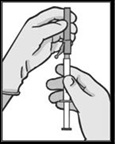
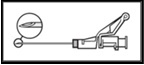
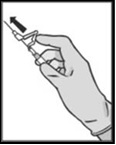
Fulvestrant Injection is a prescription medicine used in women to treat breast cancer that has spread to other parts of the body (metastatic) and has grown despite treatment with other antiestrogen medication. The solution is available in syringes containing 250mg/5ml and are available in sets of two. Both syringes have to be administered to receive a 500mg dose. The syringes are given through an injection into the muscle. The medication must be refrigerated and protected from light until time to use. The packaging contains two SafotyGlide™ 'shiolding intramuscular injection needles. The package should be discarded after use. The usual recommended dosage and administration instructions are unclear. The text includes a National Drug Code (NDC) number.*
FDA Label Image

Fulvestrant-fig-1 (Fulvestrant Fig 1)

FDA Label Image

Fulvestrant-fig-10 (Fulvestrant Fig 10)

FDA Label Image

Fulvestrant-fig-11 (Fulvestrant Fig 11)

Fulvestrant-fig-11 (Fulvestrant Fig 11)
This appears to be a chart depicting Progression-Free Survival Probability for Fulvestrant plus Abemaciclib and Fulvestrant plus Placebo interventions on a group of patients over a period of 30 months. The Y-axis represents Progression-Free Survival Probability expressed in %. The X-axis represents Time in months. The chart also shows the number of patients that were censored during the study period. The chart provides a comparison between the two interventions over time. This could be helpful in analyzing the effectiveness of the two treatments in addressing tumor growth in breast cancer patients.*
FDA Label Image

Fulvestrant-fig-12 (Fulvestrant Fig 12)

Fulvestrant-fig-12 (Fulvestrant Fig 12)
The given text represents a chart displaying observations of two sets of treatments, one with Fulvestrant and Abemaciclib (N=446) and the other with Fulvestrant and Placebo (N=223). The observations show censoring of 100 observations, and the remaining number of patients are represented on the y-axis, whereas the time at which these observations were taken is represented on the x-axis. The chart illustrates that the treatment with Fulvestrant and Abemaciclib was significantly more effective than the treatment with Fulvestrant and Placebo in treating the given condition.*
FDA Label Image

Fulvestrant-fig-13 (Fulvestrant Fig 13)

Fulvestrant-fig-13 (Fulvestrant Fig 13)
The text describes a graph showing the event-free probability (%) of a treatment called Fulvestrant-Ribocickb compared to Fulvestrant+Placebo. The x-axis displays the time in months and the y-axis indicates the number of patients. The graph displays the results for a total of 484 patients that received Fulvestrant-Ribocickb and 242 patients that received Fulvestrant+Placebo.*
FDA Label Image

Fulvestrant-fig-14 (Fulvestrant Fig 14)

Fulvestrant-fig-14 (Fulvestrant Fig 14)
This is a graph displaying the event-free probability of two treatments: Fulvestrant+Fibociclb (N=484) and Fulvestrant+Placebo (N=242) over a period of 48 months. The x-axis shows the time in months and the y-axis shows the probability percentage. The number of patients still at risk is shown on the right side of the graph.*
FDA Label Image

Fulvestrant-fig-2 (Fulvestrant Fig 2)

FDA Label Image

Fulvestrant-fig-3 (Fulvestrant Fig 3)

FDA Label Image

Fulvestrant-fig-4 (Fulvestrant Fig 4)

FDA Label Image

Fulvestrant-fig-5 (Fulvestrant Fig 5)

FDA Label Image

Fulvestrant-fig-6 (Fulvestrant Fig 6)

Fulvestrant-fig-6 (Fulvestrant Fig 6)
This appears to be a graph showing the proportion of patients who remain progression-free over time for two different dosages (250mg and 500mg) of a drug called FULVESTRANT. The graph shows the Proportion of patients progression free (Y-axis) against Time (in Months) (X-axis), with two lines representing the two dosages. The Number at risk is also mentioned.*
FDA Label Image

Fulvestrant-fig-7 (Fulvestrant Fig 7)

Fulvestrant-fig-7 (Fulvestrant Fig 7)
This is a graph showing the proportion of patients alive over time while taking Fulvestrant, with one group taking 500mg and the other taking 250mg. The number of patients at risk for each dose is provided along the x-axis, and tick marks indicate censored observations. There is a note at the bottom that says the results are not statistically significant because no adjustments were made for multiplicity.*
FDA Label Image

Fulvestrant-fig-8 (Fulvestrant Fig 8)

FDA Label Image

Fulvestrant-fig-9 (Fulvestrant Fig 9)

FDA Label Image

Fulvestrant-pfs-label (Fulvestrant Pfs Label)

Fulvestrant-pfs-label (Fulvestrant Pfs Label)
This is a product description for Fulvestrant Injection manufactured by Alembic Pharmaceuticals, Inc. The injection has a strength of 250 mg/5mL and is administered intramuscularly. The product contains two single-dose prefilled syringes that must be administered to receive the full 500 mg dose. The National Drug Code (NDC) for this product is 62332-650-05. The product should be protected from light and was manufactured in India.*
FDA Label Image

Fulvestrant-structure (Fulvestrant Structure)

* These product label images have been analyzed using experimental machine learning. Please verify findings with the primary label text.