Graph-1 (Graph 1)
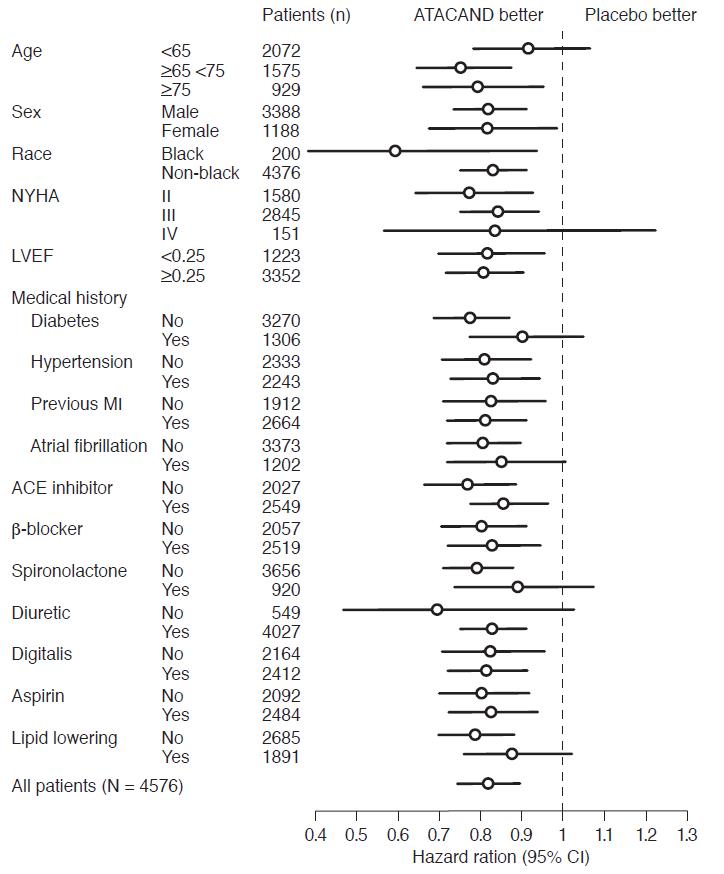
This is a table listing several parameters related to patient data, such as age, sex, race, NYHA, LVEF, etc. The table also lists patients' medical history, including diabetes, hypertension, previous MI, etc. There are treatment options listed, such as ACE inhibitor, p-blocker, spironolactone, etc. The table categorizes the given data into "ATACAND better," "Placebo better," and "Patients (n)." Finally, the table presents "Hazard Ratios." Overall, this table seems to be a medical data summary that may be used for statistical analysis.*