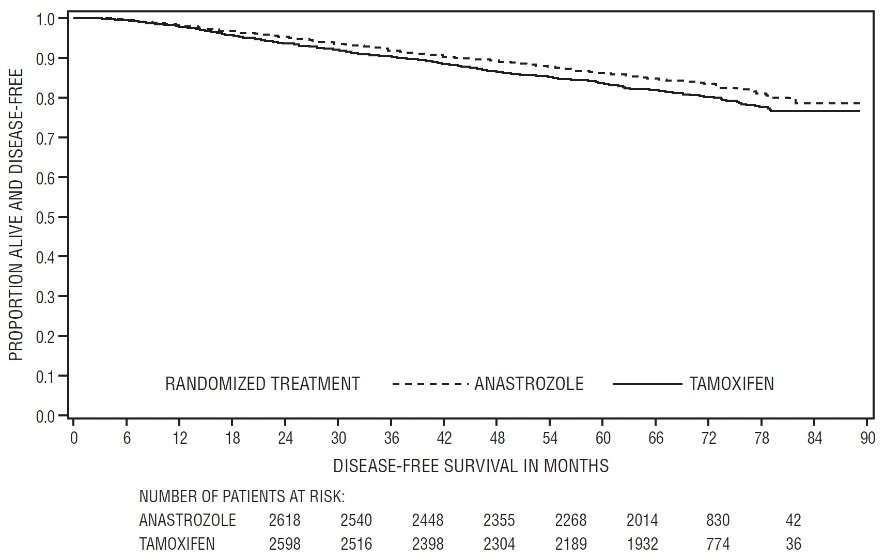
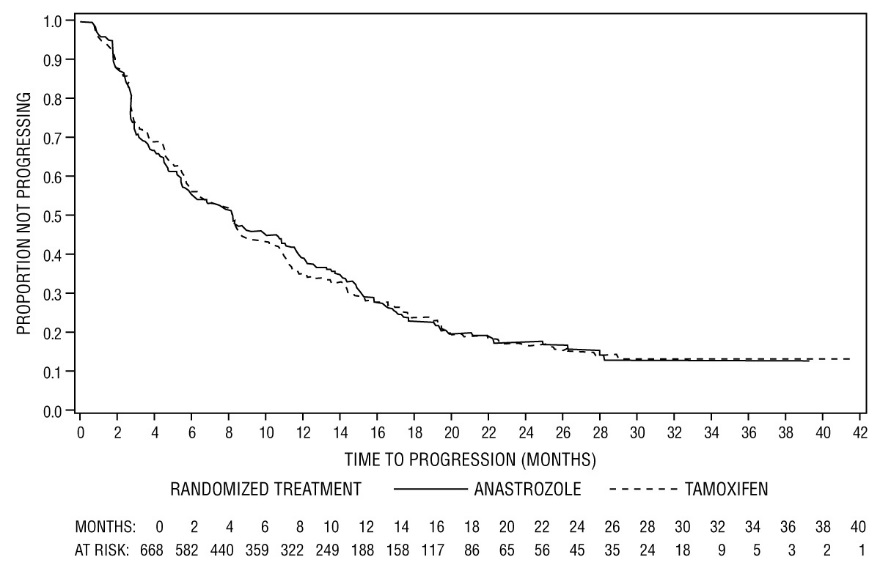
Figure-1 (Figure 1)

This is a graph showing the disease-free survival of patients treated with either anastrozole or tamoxifen. The graph shows the proportion of patients who are alive and free of disease over time, ranging from 0 to 90 months. The treatment types are indicated by different lines, with anastrozole represented by a solid line and tamoxifen represented by a dashed line. The number of patients at risk at each time point is also provided for each treatment group.*