Donepezil Hydrochloride Tablet, Film Coated
Product Images NDC 62756-194

19 FDA label images from Sun Pharmaceutical Industries, Inc. · Packaging, Regulatory Labels, and Product Appearance

Product Visual Gallery

This gallery contains 19 technical images submitted to the FDA as part of the official labeling for Donepezil Hydrochloride (NDC 62756-194). Unlike standard consumer photos, these assets often include clinical data figures, molecular chemical structures, and official manufacturer packaging layouts.

As provided by Sun Pharmaceutical Industries, Inc., these visuals offer a comprehensive scientific overview of the product's physical and chemical identity, aiding pharmacists and researchers in product verification and study.

FDA Label Image

Spl-donepezil-figure-1 (Spl Donepezil Figure 1)
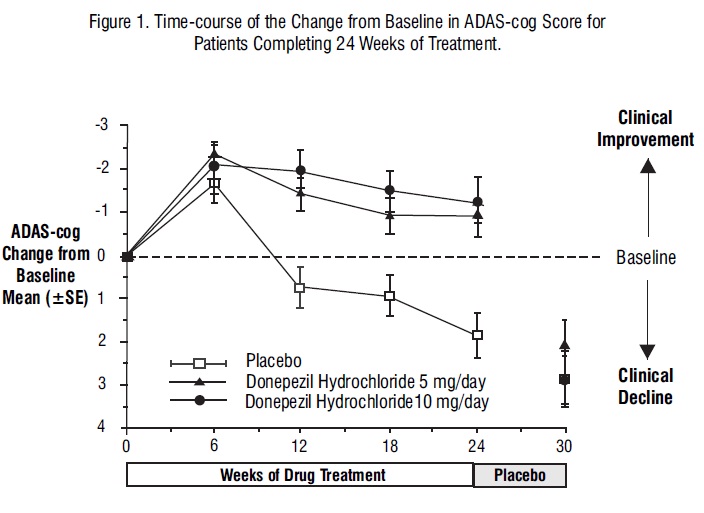
Spl-donepezil-figure-1 (Spl Donepezil Figure 1)
A line graph illustrating the time-course change from baseline in ADAS-cog scores over 24 weeks of treatment, comparing placebo, Donepezil Hydrochloride 5 mg/day, and Donepezil Hydrochloride 10 mg/day. The y-axis shows ADAS-cog change from baseline mean (±SE) ranging from -3 to 4, indicating clinical improvement above baseline and clinical decline below. The x-axis depicts weeks of drug treatment.*
FDA Label Image

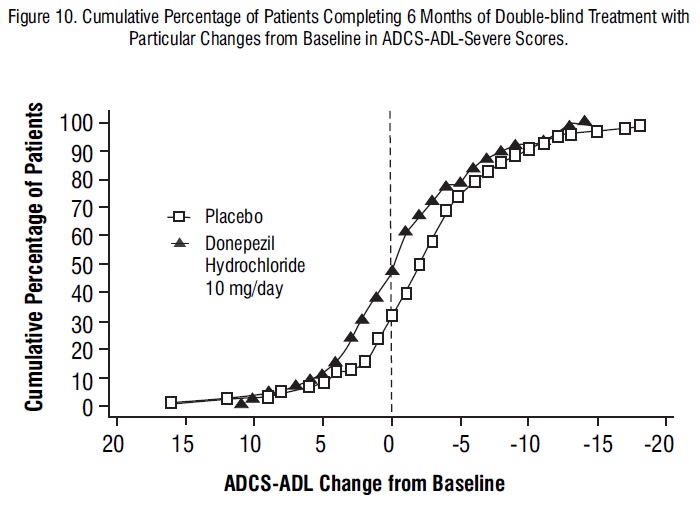
Spl-donepezil-figure-10 (Spl Donepezil Figure 10)

Spl-donepezil-figure-10 (Spl Donepezil Figure 10)
A line graph titled 'Figure 10' showing the cumulative percentage of patients completing 6 months of double-blind treatment with changes from baseline in ADCS-ADL-Severe scores. The x-axis represents ADCS-ADL Change from Baseline, ranging from 20 to -20. The y-axis shows the cumulative percentage of patients from 0 to 100%. Two lines are plotted: one for Placebo (open squares) and one for Donepezil Hydrochloride 10 mg/day (solid triangles), illustrating their respective cumulative patient percentages across changes from baseline.*
FDA Label Image

Spl-donepezil-figure-12 (Spl Donepezil Figure 12)

Spl-donepezil-figure-12 (Spl Donepezil Figure 12)
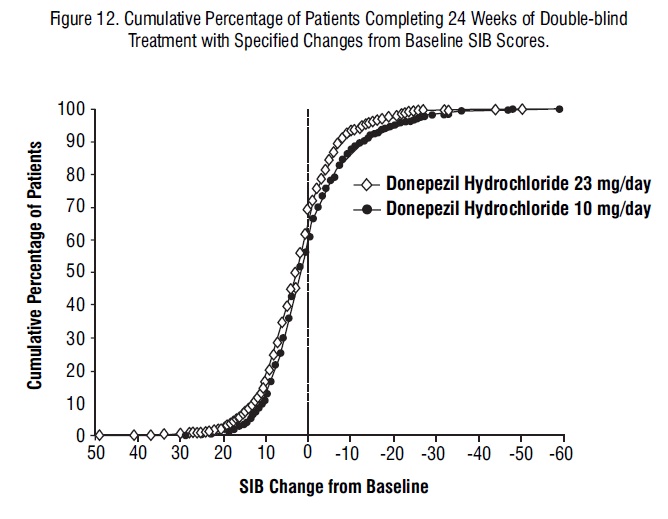
A cumulative percentage chart showing patients completing 24 weeks of double-blind treatment with Donepezil Hydrochloride 23 mg/day and 10 mg/day. The x-axis represents SIB Change from Baseline, and the y-axis shows the cumulative percentage of patients. Both dosages display similar trends in cumulative patient percentages across SIB score changes.*
FDA Label Image

Spl-donepezil-figure-13 (Spl Donepezil Figure 13)

Spl-donepezil-figure-13 (Spl Donepezil Figure 13)
A bar chart showing the frequency distribution of CIBIC-plus scores at Week 24 among patients taking Donepezil Hydrochloride. The chart compares two dosage groups, 23 mg/day and 10 mg/day, across ratings from Markedly Improved to Markedly Worse on the horizontal axis with patient percentage on the vertical axis.*
FDA Label Image

Spl-donepezil-figure-2 (Spl Donepezil Figure 2)

Spl-donepezil-figure-2 (Spl Donepezil Figure 2)
This figure presents a cumulative percentage graph of patients completing 24 weeks of double-blind treatment, showing changes from baseline ADAS-cog scores. The graph compares three groups: placebo, Donepezil Hydrochloride 5 mg/day, and 10 mg/day, with data points depicting cumulative patient percentages against changes in ADAS-cog scores from baseline ranging from -15 to 15. A table within the graph summarizes percentages of patients achieving specific score changes (-7, -4, and 0) across treatment groups.*
FDA Label Image

Spl-donepezil-figure-3 (Spl Donepezil Figure 3)

Spl-donepezil-figure-3 (Spl Donepezil Figure 3)
A bar chart showing the frequency distribution of CIBIC-plus scores at week 24 for placebo, Donepezil Hydrochloride 5 mg/day, and Donepezil Hydrochloride 10 mg/day groups. The x-axis represents CIBIC-plus ratings from Markedly Improved to Markedly Worse, and the y-axis shows the percentage of patients, illustrating comparative patient response to the treatments.*
FDA Label Image

Spl-donepezil-figure-4 (Spl Donepezil Figure 4)

Spl-donepezil-figure-4 (Spl Donepezil Figure 4)
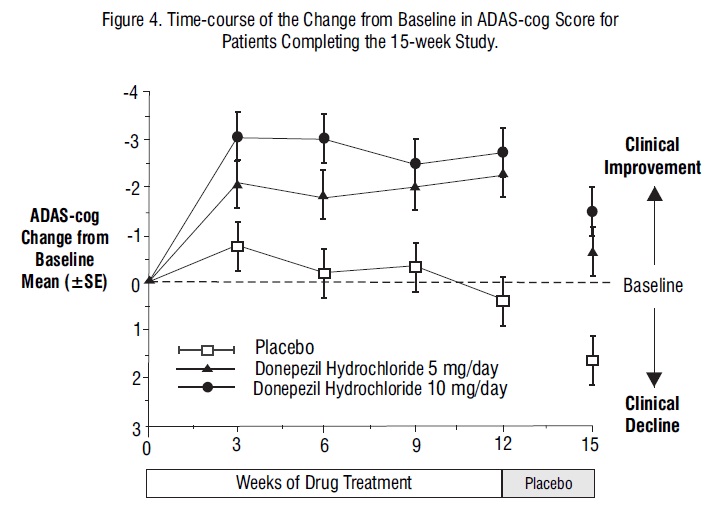
Line graph titled 'Time-course of the Change from Baseline in ADAS-cog Score for Patients Completing the 15-week Study' shows ADAS-cog score changes from baseline over 15 weeks. It compares placebo, Donepezil Hydrochloride 5 mg/day, and Donepezil Hydrochloride 10 mg/day groups, indicating clinical improvement above baseline and clinical decline below baseline. The x-axis represents weeks of drug treatment; y-axis shows ADAS-cog mean change with standard error bars.*
FDA Label Image

Spl-donepezil-figure-5 (Spl Donepezil Figure 5)

Spl-donepezil-figure-5 (Spl Donepezil Figure 5)
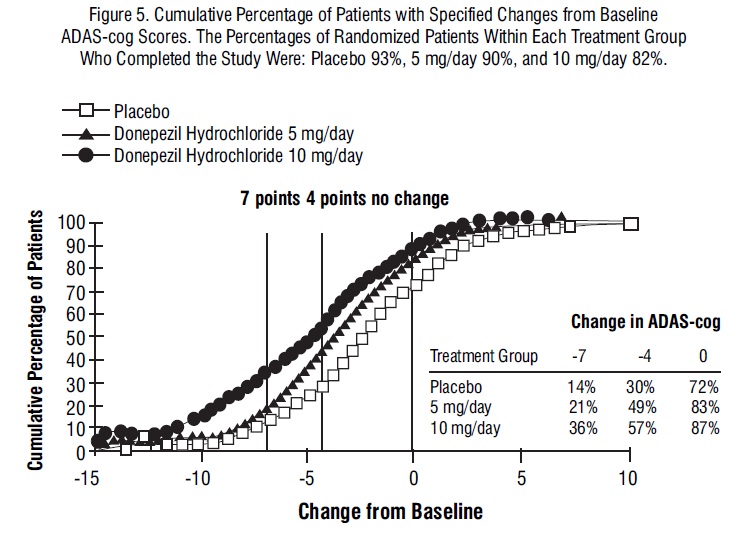
A cumulative percentage line graph showing patients with specified changes from baseline ADAS-cog scores. It compares three groups: placebo, Donepezil Hydrochloride 5 mg/day, and Donepezil Hydrochloride 10 mg/day, with cumulative percentage of patients on the y-axis and change from baseline on the x-axis. The graph highlights point markers for each group and includes a table with treatment group percentages for changes of -7, -4, and 0 in ADAS-cog scores.*
FDA Label Image

Spl-donepezil-figure-6 (Spl Donepezil Figure 6)

Spl-donepezil-figure-6 (Spl Donepezil Figure 6)
A bar chart depicting percentage of patients across CIBIC-plus Rating categories: Markedly Improved, Moderately Improved, Minimally Improved, No Change, Minimally Worse, Moderately Worse, Markedly Worse. It compares three groups: Placebo, Donepezil Hydrochloride 5 mg/day, and Donepezil Hydrochloride 10 mg/day using distinct bar shading.*
FDA Label Image

Spl-donepezil-figure-7 (Spl Donepezil Figure 7)

Spl-donepezil-figure-7 (Spl Donepezil Figure 7)
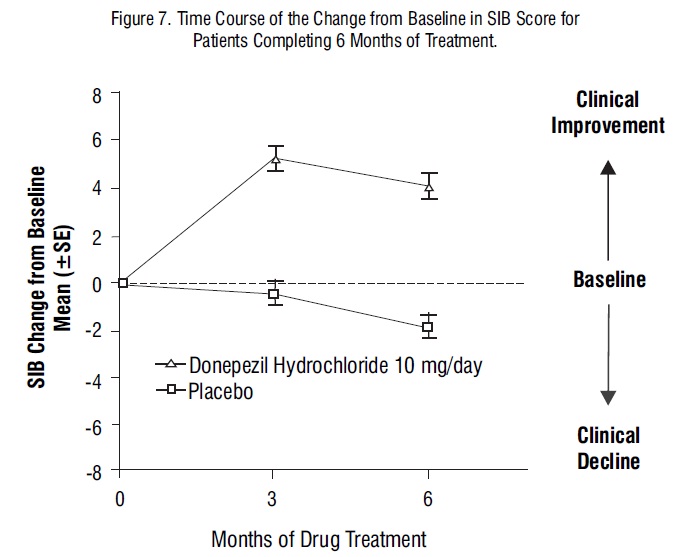
Line graph depicting the time course of change from baseline in SIB score over 6 months of treatment. It compares Donepezil Hydrochloride 10 mg/day with placebo, showing mean change on the y-axis and months of drug treatment on the x-axis. Annotations indicate clinical improvement above baseline and clinical decline below baseline.*
FDA Label Image

Spl-donepezil-figure-8 (Spl Donepezil Figure 8)

Spl-donepezil-figure-8 (Spl Donepezil Figure 8)
A cumulative percentage curve graph showing patients completing 6 months of double-blind treatment with changes from baseline in SIB scores. The graph compares placebo and Donepezil Hydrochloride 10 mg/day, plotting cumulative patient percentages against SIB change from baseline.*
FDA Label Image

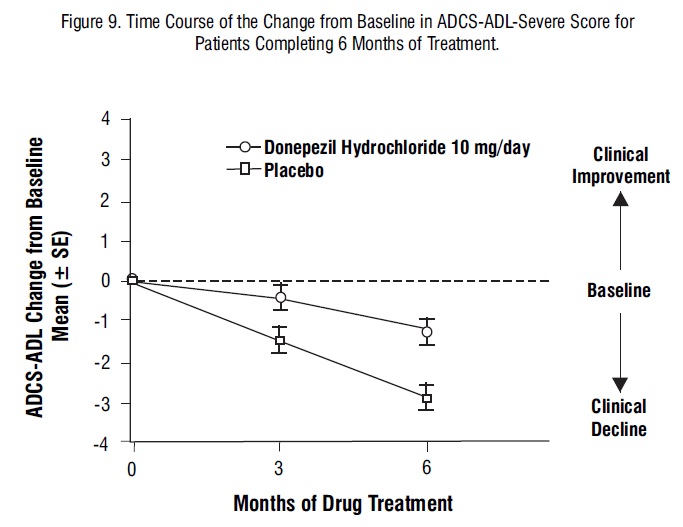
Spl-donepezil-figure-9 (Spl Donepezil Figure 9)

Spl-donepezil-figure-9 (Spl Donepezil Figure 9)
Line graph showing the time course of the change from baseline in ADCS-ADL-Severe Score over 6 months of treatment for Donepezil Hydrochloride 10 mg/day versus placebo. The vertical axis represents mean ADCS-ADL change from baseline with standard error, and the horizontal axis represents months of drug treatment. The graph shows clinical improvement or decline relative to baseline.*
FDA Label Image

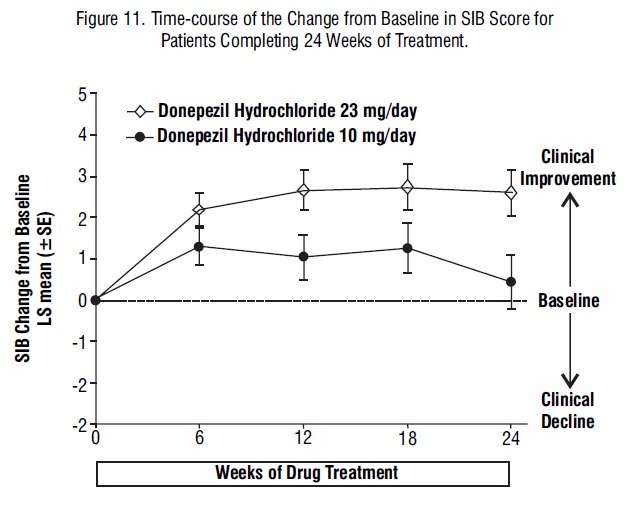
Spl-donepezil-figure11 (Spl Donepezil Figure11)

Spl-donepezil-figure11 (Spl Donepezil Figure11)
A line graph showing the time-course of the change from baseline in SIB score over 24 weeks for patients treated with Donepezil Hydrochloride 23 mg/day and 10 mg/day. The x-axis represents weeks of drug treatment (0 to 24), and the y-axis shows the LS mean change from baseline in SIB score, ranging from -2 to 5. The 23 mg/day dose line indicates greater clinical improvement compared to the 10 mg/day dose over the treatment period.*
FDA Label Image

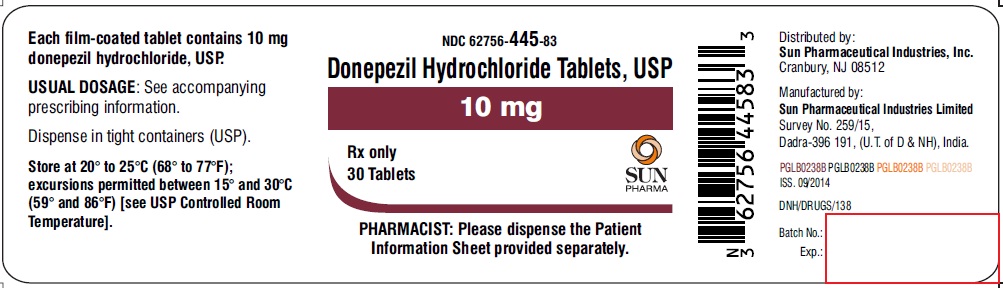
Spl-donepezil-label-10mg (Spl Donepezil Label 10mg)

Spl-donepezil-label-10mg (Spl Donepezil Label 10mg)
Donepezil Hydrochloride Tablets USP 10 mg label for 30 tablets by Sun Pharmaceutical Industries, Inc. The label includes storage instructions, dosage directions referring to prescribing information, and distribution and manufacturing details. Barcode and regulatory information are also present.*
FDA Label Image

Spl-donepezil-label-23mg (Spl Donepezil Label 23mg)

Spl-donepezil-label-23mg (Spl Donepezil Label 23mg)
Donepezil Hydrochloride Tablets 23 mg film-coated tablets label by Sun Pharmaceutical Industries, Inc. The label indicates a package containing 30 tablets with instructions to see accompanying prescribing information. Storage conditions specify 20° to 25°C with permitted excursions. It includes distributor and manufacturer details, a barcode, and a pharmacist notice to dispense with patient information leaflet.*
FDA Label Image

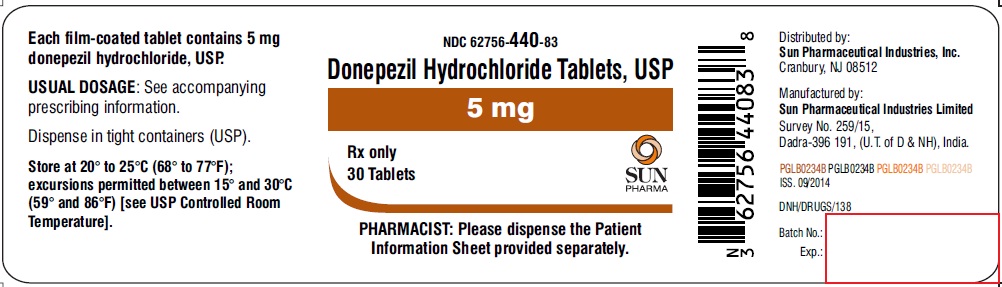
Spl-donepezil-label-5mg (Spl Donepezil Label 5mg)

Spl-donepezil-label-5mg (Spl Donepezil Label 5mg)
The label shows Donepezil Hydrochloride Tablets, USP, with a strength of 5 mg. The package contains 30 film-coated tablets. The label includes storage instructions, dosage referencing accompanying prescribing information, and notes that it is Rx only. Distributed and manufactured by Sun Pharmaceutical Industries, Inc. and Sun Pharmaceutical Industries Limited, respectively. The label also features a barcode and a logo for Sun Pharma.*
FDA Label Image

Spl-donepezil-sb-10mg (Spl Donepezil Sb 10mg)

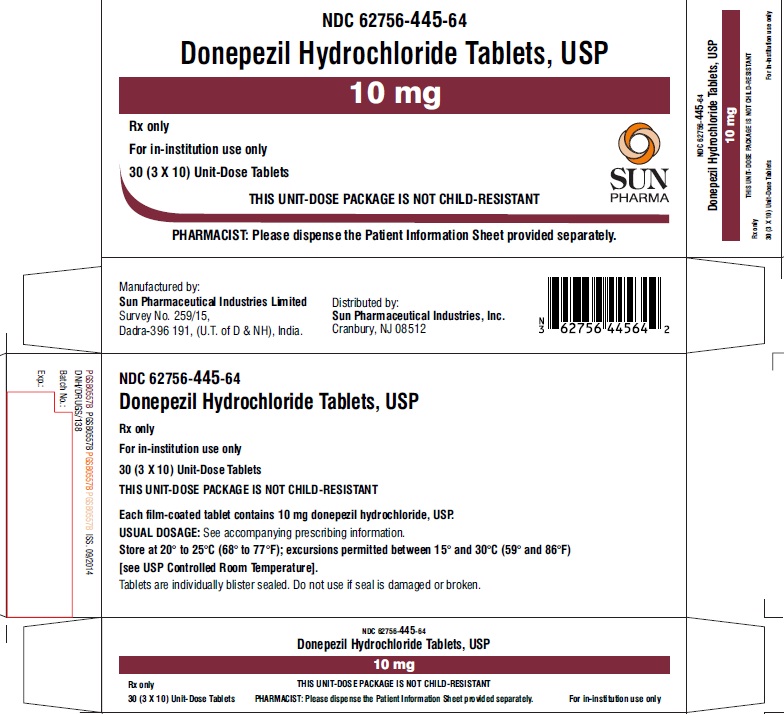
Spl-donepezil-sb-10mg (Spl Donepezil Sb 10mg)
Donepezil Hydrochloride Tablets, USP 10 mg unit-dose packaging label from Sun Pharmaceutical Industries, Inc. The label indicates 30 tablets (3 trays of 10), for in-institution use only, and states the package is not child-resistant. It includes manufacturer and distributor information, storage instructions, and a barcode.*
FDA Label Image

Spl-donepezil-sb-5mg (Spl Donepezil Sb 5mg)

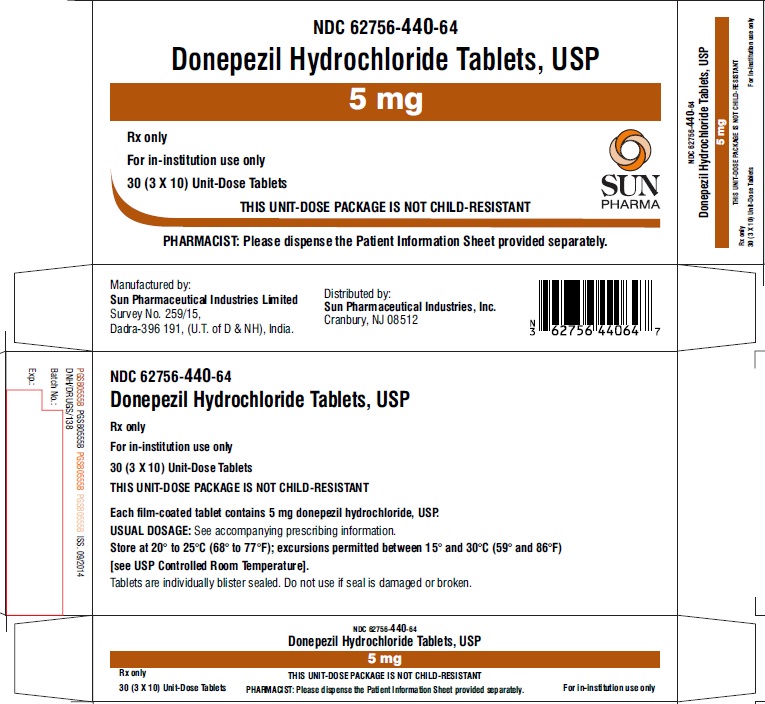
Spl-donepezil-sb-5mg (Spl Donepezil Sb 5mg)
Donepezil Hydrochloride Tablets, USP 5 mg unit-dose packaging label from Sun Pharmaceutical Industries, Inc. The label specifies 30 tablets in a 3 x 10 unit-dose format, for in-institution use only, and states that the package is not child-resistant. It includes manufacturer and distributor information with storage instructions and dispensing guidance for pharmacists.*
FDA Label Image

Spl-donepezil-structure (Spl Donepezil Structure)

Spl-donepezil-structure (Spl Donepezil Structure)
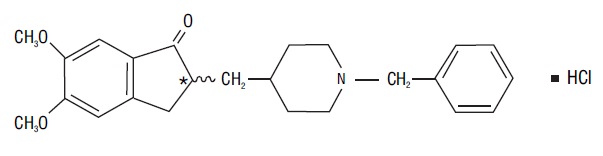
Chemical structure diagram of Donepezil Hydrochloride showing its molecular framework, including methoxy groups, a piperidine ring, and a benzyl group with hydrochloride attachment.*

* About these descriptions: Image descriptions on this page are generated by automated AI analysis of the product label images from the manufacturer's FDA label submission (SPL). They are provided for reference only and may contain errors or omissions. Always rely on the printed label itself and the official FDA labeling, and consult a pharmacist or healthcare professional with any questions about this product.