Spl-donepezil-figure-1 (Spl Donepezil Figure 1)
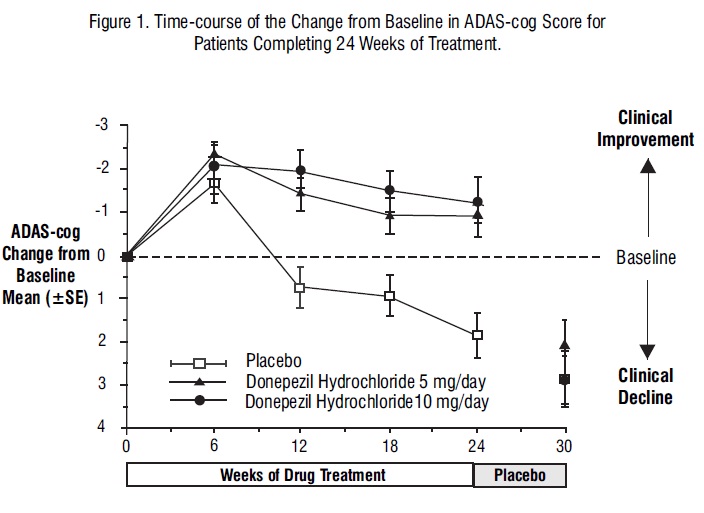
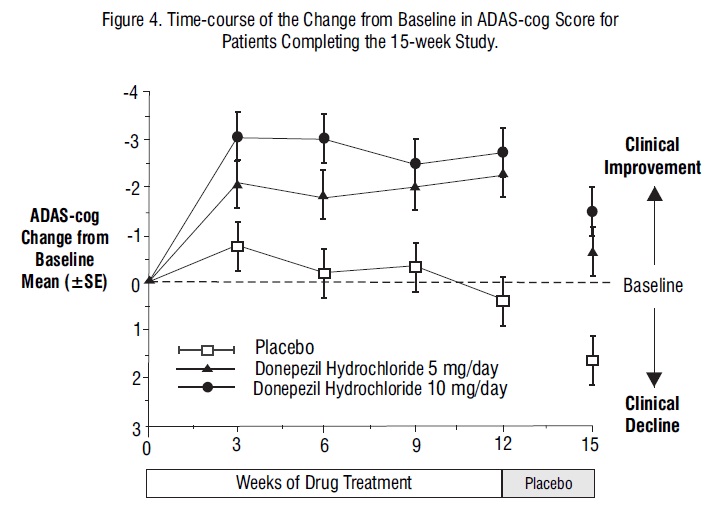
The image shows a figure depicting the Time-course of Change in ADAS-cog score for patients completing 24 weeks of treatment. The graph represents mean (+SE) of ADAS-cog score change from baseline for patients receiving Placebo, Donepezil Hydrochloride 5 mg/day and Donepezil Hydrochloride 10 mg/day. The X-axis represents weeks of drug treatment and the Y-axis represents the ADAS-cog score change from baseline. It displays clinical improvement and clinical decline.*