Aricept
Product Images NDC 62856-831

19 FDA label images from Eisai Inc. · Packaging, Regulatory Labels, and Product Appearance

Product Visual Gallery

This gallery contains 19 technical images submitted to the FDA as part of the official labeling for Aricept (NDC 62856-831). Unlike standard consumer photos, these assets often include clinical data figures, molecular chemical structures, and official manufacturer packaging layouts.

As provided by Eisai Inc., these visuals offer a comprehensive scientific overview of the product's physical and chemical identity, aiding pharmacists and researchers in product verification and study.

FDA Label Image

Chemical Structure (Aricept 01)
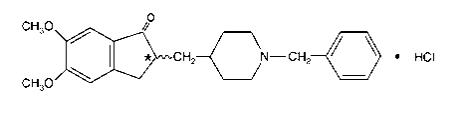
Chemical Structure (Aricept 01)
Chemical structure of the active ingredient in Aricept ODT, showing a detailed molecular diagram including aromatic rings, methoxy groups, and a hydrochloride (HCl) component.*
FDA Label Image

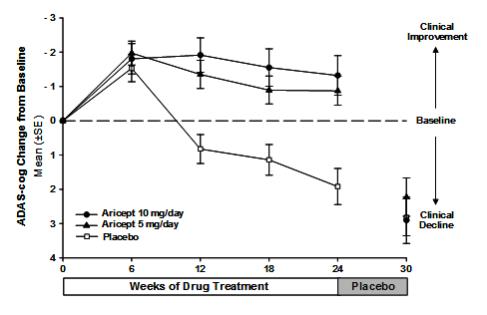
Figure 1. Time-course Of The Change From Baseline In Adas-cog Score For Patients Completing 24 Weeks Of Treatment. (Aricept 02)

Figure 1. Time-course Of The Change From Baseline In Adas-cog Score For Patients Completing 24 Weeks Of Treatment. (Aricept 02)
A line graph comparing ADAS-cog change from baseline over 24 weeks of drug treatment and a subsequent placebo period, showing clinical improvement or decline. It includes data for Aricept 10 mg/day, Aricept 5 mg/day, and placebo with mean values and error bars plotted versus weeks.*
FDA Label Image

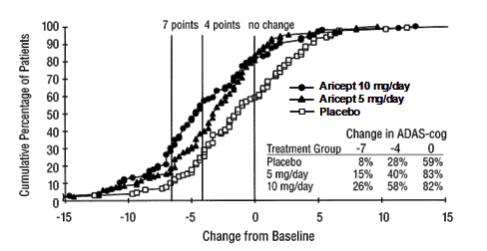
Figure 2. Cumulative Percentage Of Patients Completing 24 Weeks Of Double-blind Treatment With Specified Changes From Baseline Adas Cog Scores. The Percentages Of Randomized Patients Who Completed The Study Were: Placebo 80%, 5 mg/day 85%, And 10 mg/day 68%. (Aricept 03)

Figure 2. Cumulative Percentage Of Patients Completing 24 Weeks Of Double-blind Treatment With Specified Changes From Baseline Adas Cog Scores. The Percentages Of Randomized Patients Who Completed The Study Were: Placebo 80%, 5 mg/day 85%, And 10 mg/day 68%. (Aricept 03)
A cumulative percentage of patients chart showing change from baseline in ADAS-cog scores comparing Aricept 10 mg/day, Aricept 5 mg/day, and placebo groups. The x-axis shows change from baseline, and the y-axis shows cumulative percentage of patients. A table within the chart summarizes percentage improvement at 7, 4, and 0 points for each group.*
FDA Label Image

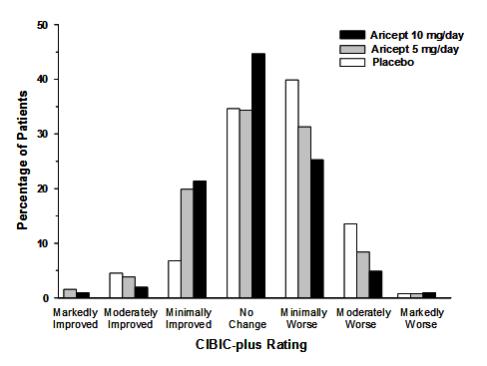
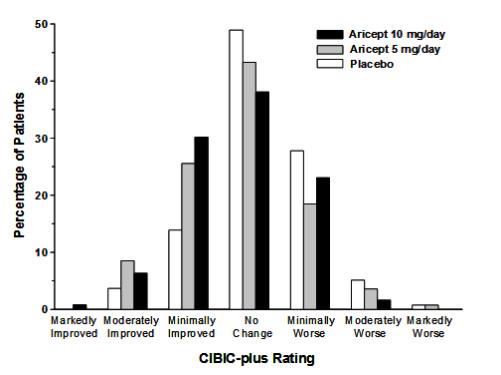
Figure 3. Frequency Distribution Of Cibic-plus Scores At Week 24. (Aricept 04)

Figure 3. Frequency Distribution Of Cibic-plus Scores At Week 24. (Aricept 04)
A bar chart showing the percentage of patients by CIBIC-plus Rating categories for Aricept 10 mg/day, Aricept 5 mg/day, and placebo groups. The categories on the x-axis range from Markedly Improved to Markedly Worse, with a notable proportion of patients showing No Change or Minimal Worsening across groups.*
FDA Label Image

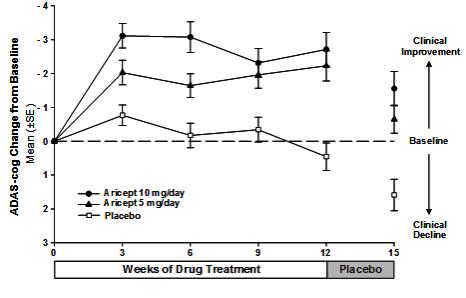
Figure 4. Time-course Of The Change From Baseline In Adas-cog Score For Patients Completing The 15-week Study. (Aricept 05)

Figure 4. Time-course Of The Change From Baseline In Adas-cog Score For Patients Completing The 15-week Study. (Aricept 05)
A line graph depicting the change from baseline in ADAS-cog scores over 15 weeks for Aricept ODT 5 mg/day, 10 mg/day, and placebo groups. The y-axis shows mean change with standard error, with clinical improvement upward and decline downward. Treatment duration is on the x-axis, including a placebo switch period.*
FDA Label Image

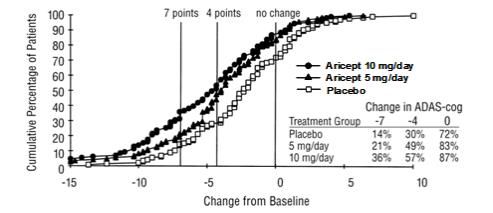
Figure 5. Cumulative Percentage Of Patients With Specified Changes From Baseline Adas-cog Scores. The Percentages Of Randomized Patients Within Each Treatment Group Who Completed The Study Were: Placebo 93%, 5 mg/day 90%, And 10 mg/day 82%. (Aricept 06)

Figure 5. Cumulative Percentage Of Patients With Specified Changes From Baseline Adas-cog Scores. The Percentages Of Randomized Patients Within Each Treatment Group Who Completed The Study Were: Placebo 93%, 5 mg/day 90%, And 10 mg/day 82%. (Aricept 06)
A cumulative percentage line graph comparing change from baseline in ADAS-cog scores over a range from -15 to 10. It depicts three treatment groups: Aricept 10 mg/day, Aricept 5 mg/day, and placebo. The graph includes markers indicating 7 points, 4 points, and no change thresholds, with accompanying percentage values for each treatment group at these points.*
FDA Label Image

Figure 6. Frequency Distribution Of Cibic-plus Scores At Week 12. (Aricept 07)

Figure 6. Frequency Distribution Of Cibic-plus Scores At Week 12. (Aricept 07)
A bar chart depicting the CIBIC-plus rating outcomes for patients on Aricept 10 mg/day, Aricept 5 mg/day, and placebo. The x-axis shows patient improvement categories from Markedly Improved to Markedly Worse, and the y-axis represents the percentage of patients in each category, comparing the effects of the two Aricept doses against placebo groups.*
FDA Label Image

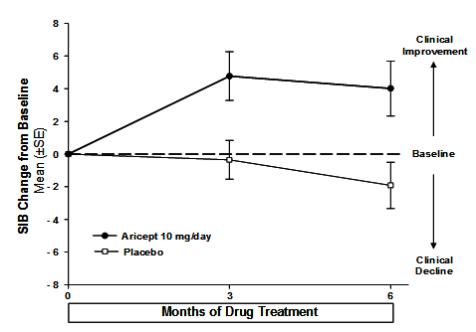
Figure 7. Time Course Of The Change From Baseline In Sib Score For Patients Completing 6 Months Of Treatment. (Aricept 08)

Figure 7. Time Course Of The Change From Baseline In Sib Score For Patients Completing 6 Months Of Treatment. (Aricept 08)
A line graph depicting SIB (Severe Impairment Battery) change from baseline over 6 months of drug treatment, comparing Aricept 10 mg/day and placebo. The y-axis shows mean ± SE, with Aricept showing clinical improvement and placebo showing clinical decline over the study period.*
FDA Label Image

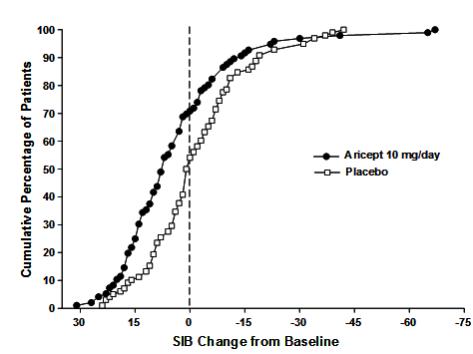
Figure 8. Cumulative Percentage Of Patients Completing 6 Months Of Double-blind Treatment With Particular Changes From Baseline In Sib Scores. (Aricept 09)

Figure 8. Cumulative Percentage Of Patients Completing 6 Months Of Double-blind Treatment With Particular Changes From Baseline In Sib Scores. (Aricept 09)
A cumulative percentage curve chart comparing Aricept 10 mg/day and placebo groups, showing the change from baseline in SIB (Severe Impairment Battery) scores. The x-axis represents SIB change from baseline and the y-axis shows the cumulative percentage of patients, demonstrating differences in response between treatment and placebo.*
FDA Label Image

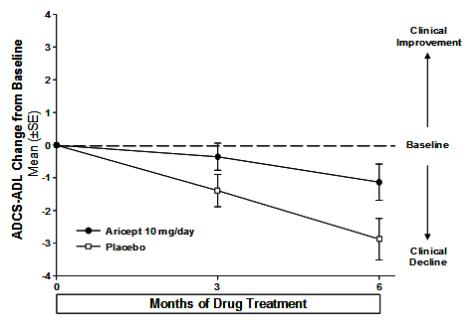
Figure 9. Time Course Of The Change From Baseline In Adcs-adl-severe Score For Patients Completing 6 Months Of Treatment. (Aricept 0a)

Figure 9. Time Course Of The Change From Baseline In Adcs-adl-severe Score For Patients Completing 6 Months Of Treatment. (Aricept 0a)
A line graph illustrating the ADCS-ADL change from baseline over 6 months of drug treatment, comparing Aricept 10 mg/day and placebo groups. The y-axis shows mean change (±SE) from baseline, indicating clinical improvement above and clinical decline below baseline. The Aricept group shows less decline than placebo over time.*
FDA Label Image

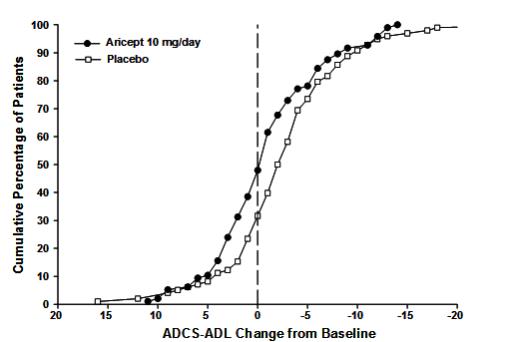
Figure 10. Cumulative Percentage Of Patients Completing 6 Months Of Double-blind Treatment With Particular Changes From Baseline In Adcs-adl-severe Scores. (Aricept 0b)

Figure 10. Cumulative Percentage Of Patients Completing 6 Months Of  Double-blind Treatment With Particular Changes From Baseline In Adcs-adl-severe Scores. (Aricept 0b)
A cumulative percentage of patients graph showing the comparison of Aricept 10 mg/day versus placebo on ADCS-ADL change from baseline. The X-axis represents the ADCS-ADL change from baseline ranging from +20 to -20, and the Y-axis shows the cumulative percentage of patients from 0 to 100%. Aricept is represented with solid black circles and placebo with open squares.*
FDA Label Image

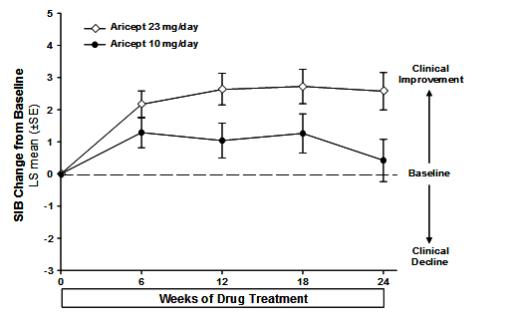
Figure 11. Time-course Of The Change From Baseline In Sib Score For Patients Completing 24 Weeks Of Treatment. (Aricept 0c)

Figure 11. Time-course Of The Change From Baseline In Sib Score For Patients Completing 24 Weeks Of Treatment. (Aricept 0c)
A line graph showing the change in SIB (Severe Impairment Battery) scores from baseline over 24 weeks of treatment with Aricept ODT at doses of 10 mg/day and 23 mg/day. The graph depicts clinical improvement and decline, with SIB change on the vertical axis and weeks of drug treatment on the horizontal axis. Error bars indicate standard error.*
FDA Label Image

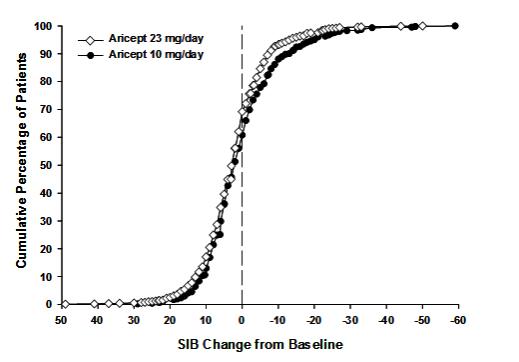
Figure 12. Cumulative Percentage Of Patients Completing 24 Weeks Of Double-blind Treatment With Specified Changes From Baseline Sib Scores. (Aricept 0d)

Figure 12. Cumulative Percentage Of Patients Completing 24 Weeks Of Double-blind Treatment With Specified Changes From Baseline Sib Scores. (Aricept 0d)
A cumulative percentage plot showing patient responses to Aricept ODT at 10 mg/day and 23 mg/day doses. The x-axis represents the SIB change from baseline, and the y-axis shows the cumulative percentage of patients. Data points depict response distributions for both dosage groups.*
FDA Label Image

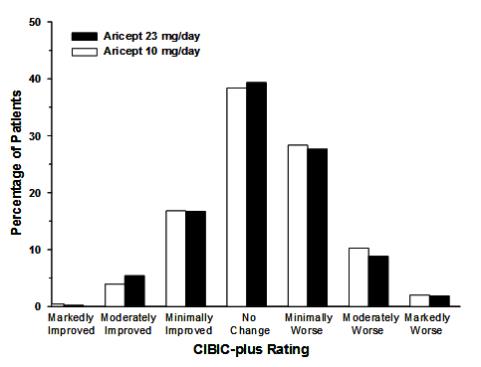
Figure 13. Frequency Distribution Of Cibic-plus Scores At Week 24. (Aricept 0e)

Figure 13. Frequency Distribution Of Cibic-plus Scores At Week 24. (Aricept 0e)
A bar chart comparing the percentage of patients with different levels of clinical change according to the CIBIC-plus Rating for Aricept 23 mg/day and 10 mg/day. Categories include Markedly Improved, Moderately Improved, Minimally Improved, No Change, Minimally Worse, Moderately Worse, and Markedly Worse.*
FDA Label Image

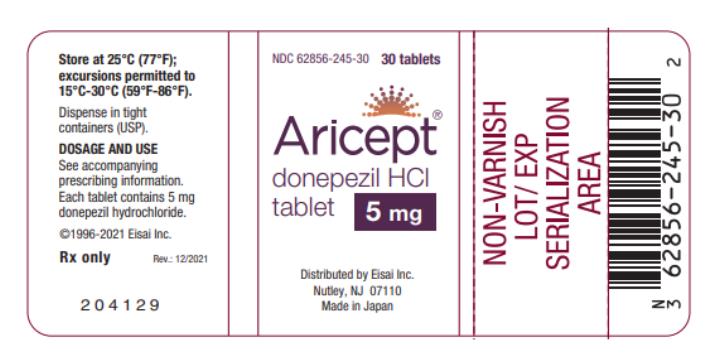
Ndc 62856-245-30aricept® 5(donepezil HCl Tablets)5 mg30 Tablets (Aricept 0f)

Ndc 62856-245-30aricept® 5(donepezil HCl Tablets)5 mg30 Tablets (Aricept 0f)
Packaging label for Aricept 5 mg tablet, containing donepezil HCl as the active ingredient. The label includes storage instructions, dosage reference, and distributor information from Eisai Inc. It indicates a quantity of 30 tablets and features a barcode and non-varnish area markings.*
FDA Label Image

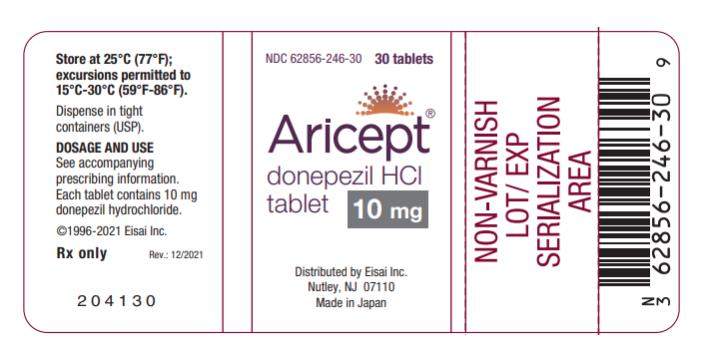
Ndc 62856-246-30aricept® 10(donepezil HCl Tablets)10 mg30 Tablets (Aricept 10)

Ndc 62856-246-30aricept® 10(donepezil HCl Tablets)10 mg30 Tablets (Aricept 10)
Aricept 10 mg tablet label displaying donepezil HCl as the active ingredient. The label indicates a 30-tablet package, distributed by Eisai Inc., Nutley, NJ, and made in Japan. Storage instructions note 25°C with permitted excursions between 15°C and 30°C. The label includes a barcode and mentions Rx only status.*
FDA Label Image

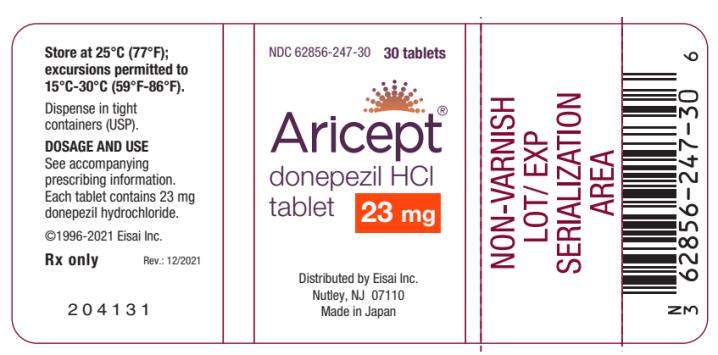
Ndc 62856-247-30aricept®donepezil HCl23 mg30 Tablets (Aricept 11)

Ndc 62856-247-30aricept®donepezil HCl23 mg30 Tablets (Aricept 11)
Aricept donepezil HCl 23 mg tablet label distributed by Eisai Inc. The label includes storage instructions at 25°C with allowed excursions, dosage directions referring to prescribing information, and indicates prescription use only. It displays the NDC 62856-247-30, serialization details, and specifies the product is made in Japan.*
FDA Label Image

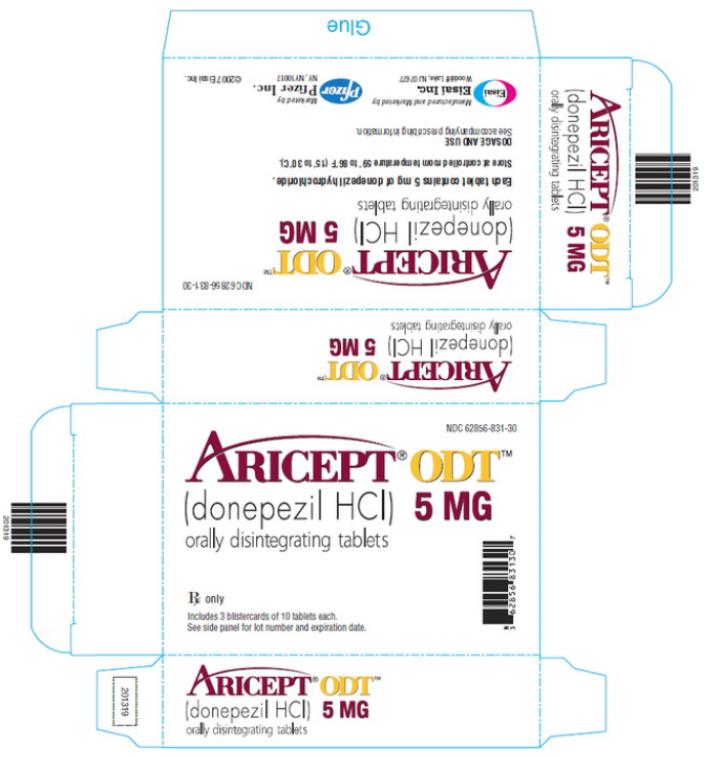
Ndc 62856-831-30aricept® Odt™(donepezil HCl) 5 mgorally Disintegrating Tablets (Aricept 12)

Ndc 62856-831-30aricept® Odt™(donepezil HCl) 5 mgorally Disintegrating Tablets (Aricept 12)
Packaging label for Aricept ODT 5 MG (donepezil HCl) orally disintegrating tablets, Rx only. The label shows the product name, strength, dosage form, and manufacturer details, including Eisai Inc. It includes barcode and labeler information, specifying that the package contains 3 blister cards of 10 tablets each.*
FDA Label Image

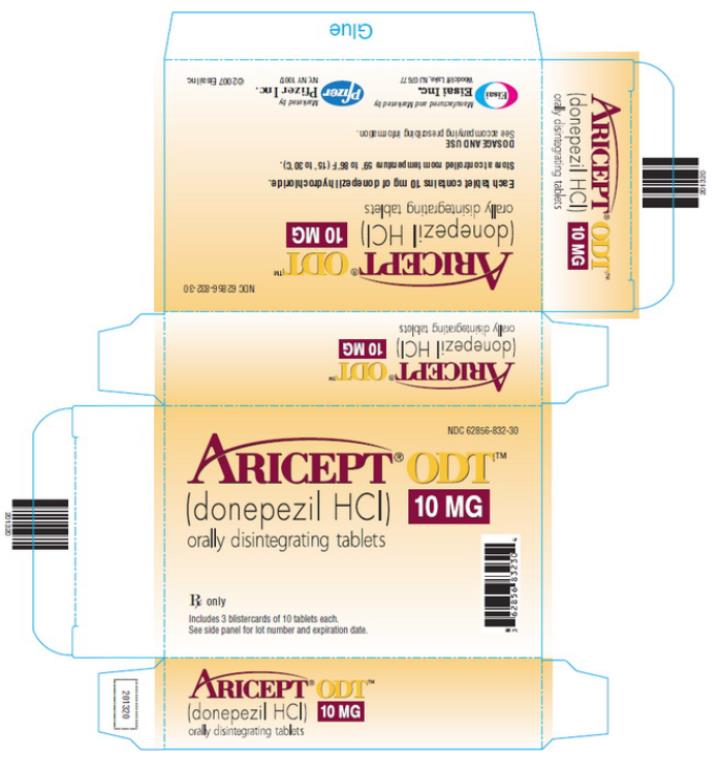
Ndc 62856-832-30aricept® Odt™(donepezil HCl) 10 mgorally Disintegrating Tablets (Aricept 13)

Ndc 62856-832-30aricept® Odt™(donepezil HCl) 10 mgorally Disintegrating Tablets (Aricept 13)
Packaging label for Aricept ODT 10 mg orally disintegrating tablets containing donepezil HCl, marketed by Eisai Inc. The label indicates prescription use and includes a barcode and NDC number. The box contains 3 blister cards of 10 tablets each.*

* About these descriptions: Image descriptions on this page are generated by automated AI analysis of the product label images from the manufacturer's FDA label submission (SPL). They are provided for reference only and may contain errors or omissions. Always rely on the printed label itself and the official FDA labeling, and consult a pharmacist or healthcare professional with any questions about this product.