Figure1 (88824e10 1c76 4b45 A051 Aa8007055519 02)
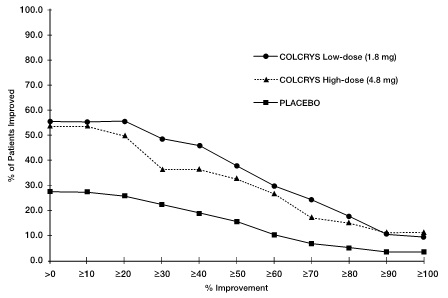
This text represents a graph showing the percentage improvement of patients who were treated with COLCYS Low-dose and COLCYS High-dose. The x-axis represents time in months, while the y-axis represents the percentage of patients who showed improvement. The percentage values range from 0 to 100, with intervals of 20. The actual percentage values are not legible due to errors.*