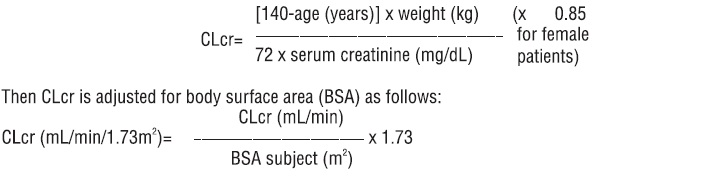
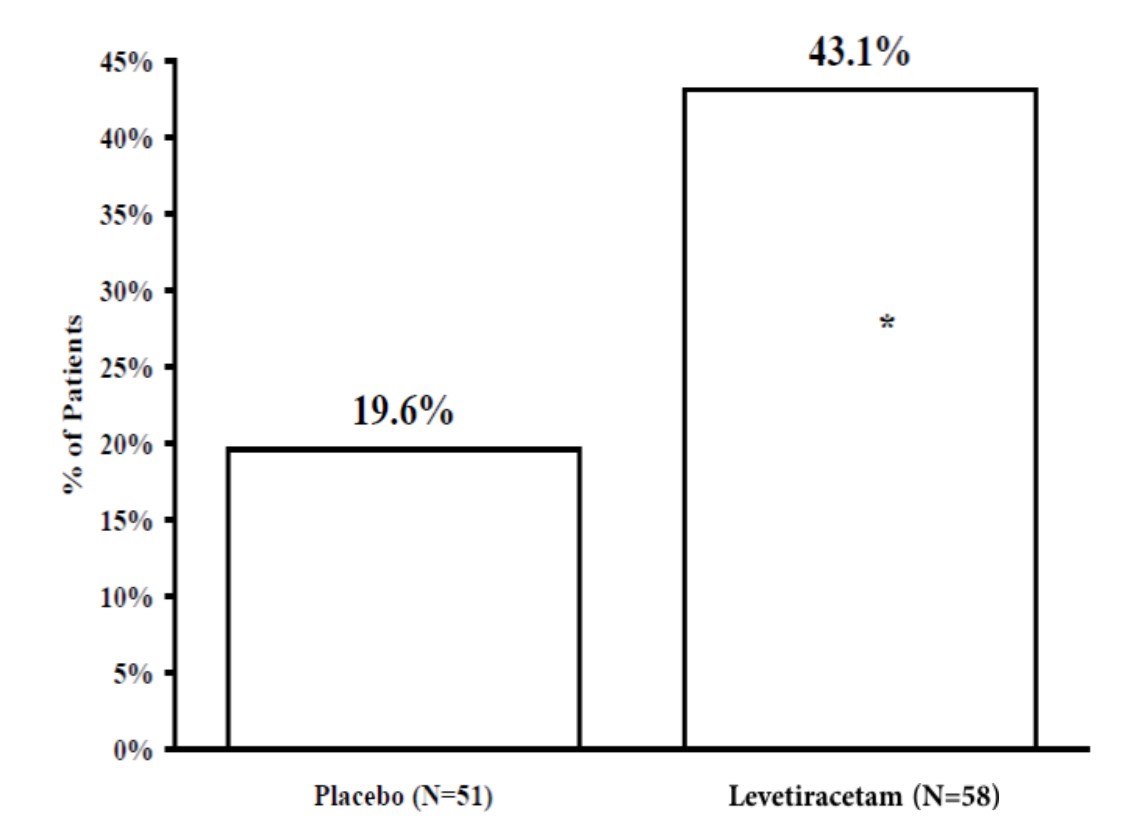
Figure 1 (2c7560b9 9503 43bd 811d 13f6d3957081 01)
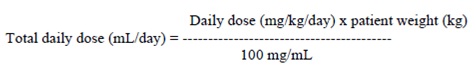
This is a formula for calculating the total daily dose in milliliters, based on the patient's weight and the daily dose in milligrams per kilogram. The concentration of the medication is 100 mg/mL.*