Clopidogrel Tablet, Film Coated
Product Images NDC 63187-362

10 FDA label images from Proficient Rx Lp · Packaging, Regulatory Labels, and Product Appearance

Product Visual Gallery

This gallery contains 10 technical images submitted to the FDA as part of the official labeling for Clopidogrel (NDC 63187-362). Unlike standard consumer photos, these assets often include clinical data figures, molecular chemical structures, and official manufacturer packaging layouts.

As provided by Proficient Rx Lp, these visuals offer a comprehensive scientific overview of the product's physical and chemical identity, aiding pharmacists and researchers in product verification and study.

FDA Label Image

Structural Formula For Clopidogrel Bisulfate (Image 01)

Structural Formula For Clopidogrel Bisulfate (Image 01)
Chemical structure of clopidogrel sulfate, showing its molecular configuration including the thiophene ring, chlorophenyl group, and carboxylate methyl ester components.*
FDA Label Image

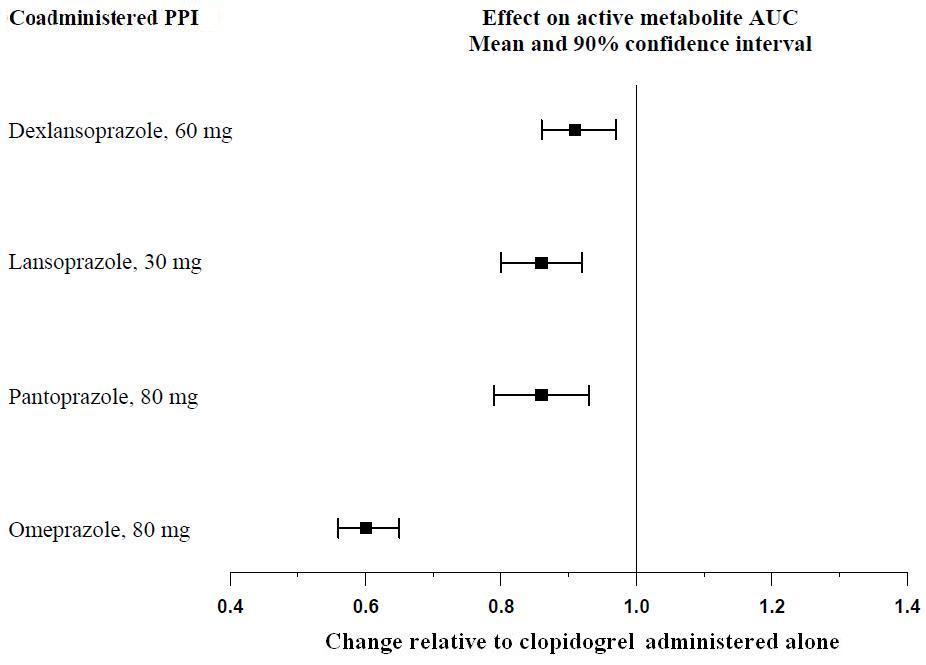
Figure 1 (Image 02)

Figure 1 (Image 02)
A horizontal forest plot showing the effect of coadministered proton pump inhibitors (PPIs) on the active metabolite area under the curve (AUC) of clopidogrel. The graph compares mean and 90% confidence intervals for four PPIs: dexlansoprazole 60 mg, lansoprazole 30 mg, pantoprazole 80 mg, and omeprazole 80 mg, illustrating changes relative to clopidogrel administered alone.*
FDA Label Image

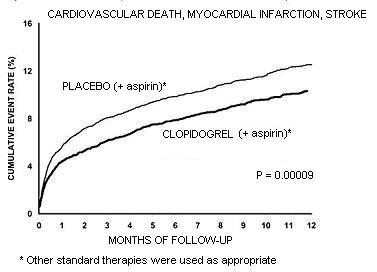
Figure 2 (Image 03)

Figure 2 (Image 03)
A cumulative event rate graph over 12 months comparing cardiovascular death, myocardial infarction, and stroke between placebo plus aspirin and clopidogrel plus aspirin treatments. The cumulative event percentage is plotted on the y-axis, and months of follow-up on the x-axis, showing lower event rates for the clopidogrel group. Statistical significance (P = 0.00009) is indicated.*
FDA Label Image

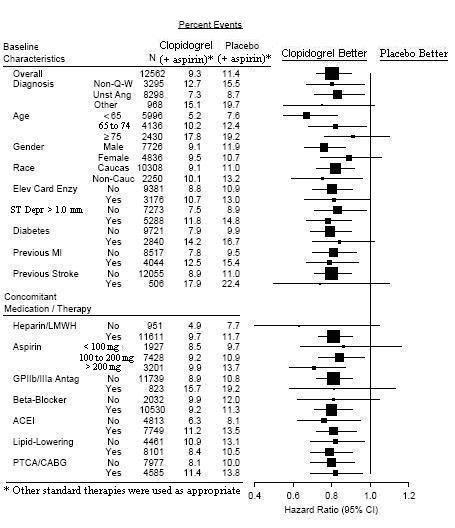
Figure 3 (Image 04)

Figure 3 (Image 04)
A forest plot showing comparative hazard ratios with 95% confidence intervals for Clopidogrel versus placebo across various baseline characteristics and concomitant medications or therapies. The horizontal axis represents hazard ratios ranging from 0.4 to 1.2, with a vertical line indicating equivalence. The plot includes subgroups by diagnosis, age, gender, race, cardiac enzyme elevation, diabetes, prior myocardial infarction, prior stroke, and several medication categories.*
FDA Label Image

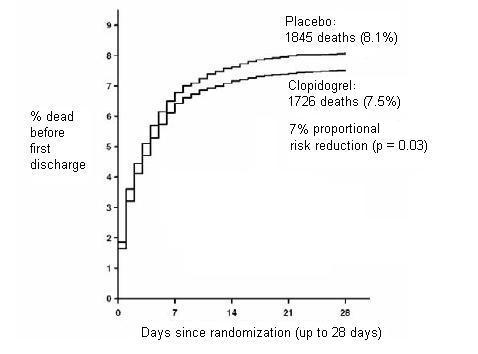
Figure 4 (Image 05)

Figure 4 (Image 05)
A Kaplan-Meier survival curve graph comparing the percentage of deaths before first discharge over 28 days since randomization between Clopidogrel and placebo groups. The graph shows a slightly lower percentage of deaths in the Clopidogrel group, with numerical annotations of total deaths and percentage, and a 7% proportional risk reduction (p = 0.03).*
FDA Label Image

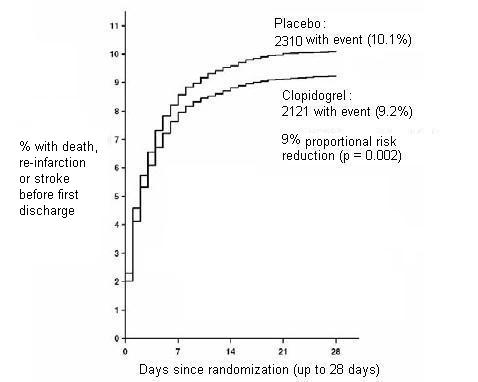
Figure 5 (Image 06)

Figure 5 (Image 06)
A line graph comparing percentages of death, re-infarction, or stroke before first discharge over up to 28 days post-randomization between Clopidogrel 75 mg oral tablets and placebo. It shows lower event rates in the Clopidogrel group compared to placebo, with a noted 9% proportional risk reduction (p=0.002).*
FDA Label Image

Figure 6 (Image 07)

Figure 6 (Image 07)
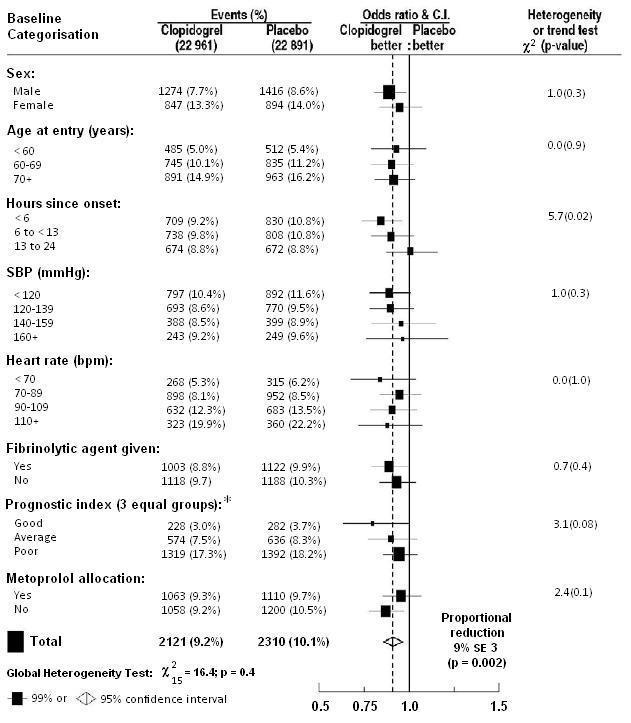
A forest plot comparing event percentages between Clopidogrel and placebo groups across baseline categories such as sex, age, hours since onset, systolic blood pressure, heart rate, fibrinolytic agent use, prognostic index, and metoprolol allocation. The plot shows odds ratios with confidence intervals, indicating Clopidogrel's effect relative to placebo, alongside heterogeneity test p-values and a summary proportional reduction statistic.*
FDA Label Image

Figure 7 (Image 08)

Figure 7 (Image 08)
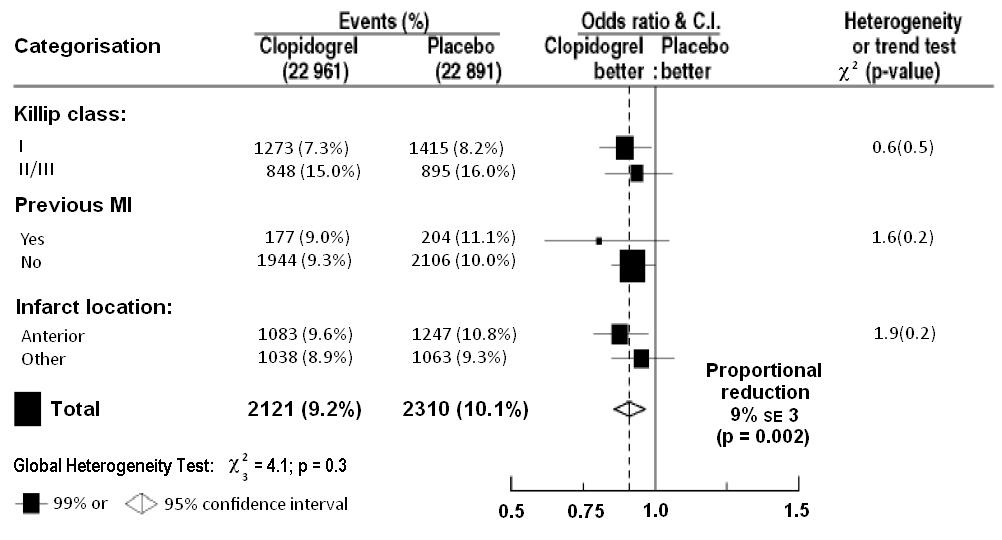
A forest plot chart comparing the percentage of events between Clopidogrel and placebo groups across different categories: Killip class, previous myocardial infarction (MI), and infarct location. The chart shows odds ratios with confidence intervals, indicating a proportional reduction of 9% with Clopidogrel treatment. The total events and heterogeneity p-values are also presented.*
FDA Label Image

Figure 8 (Image 09)

Figure 8 (Image 09)
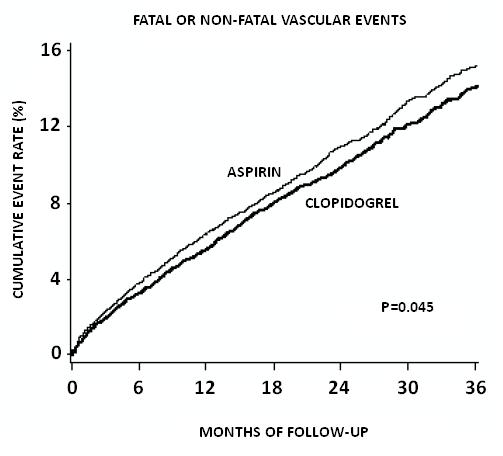
A line graph showing cumulative event rate percentages for fatal or non-fatal vascular events over 36 months of follow-up. Two lines compare the event rates for aspirin and clopidogrel, with event rates increasing over time. The graph includes a p-value of 0.045, indicating a statistical comparison between the two treatments.*
FDA Label Image

63187-362-30 (Image 10)

63187-362-30 (Image 10)
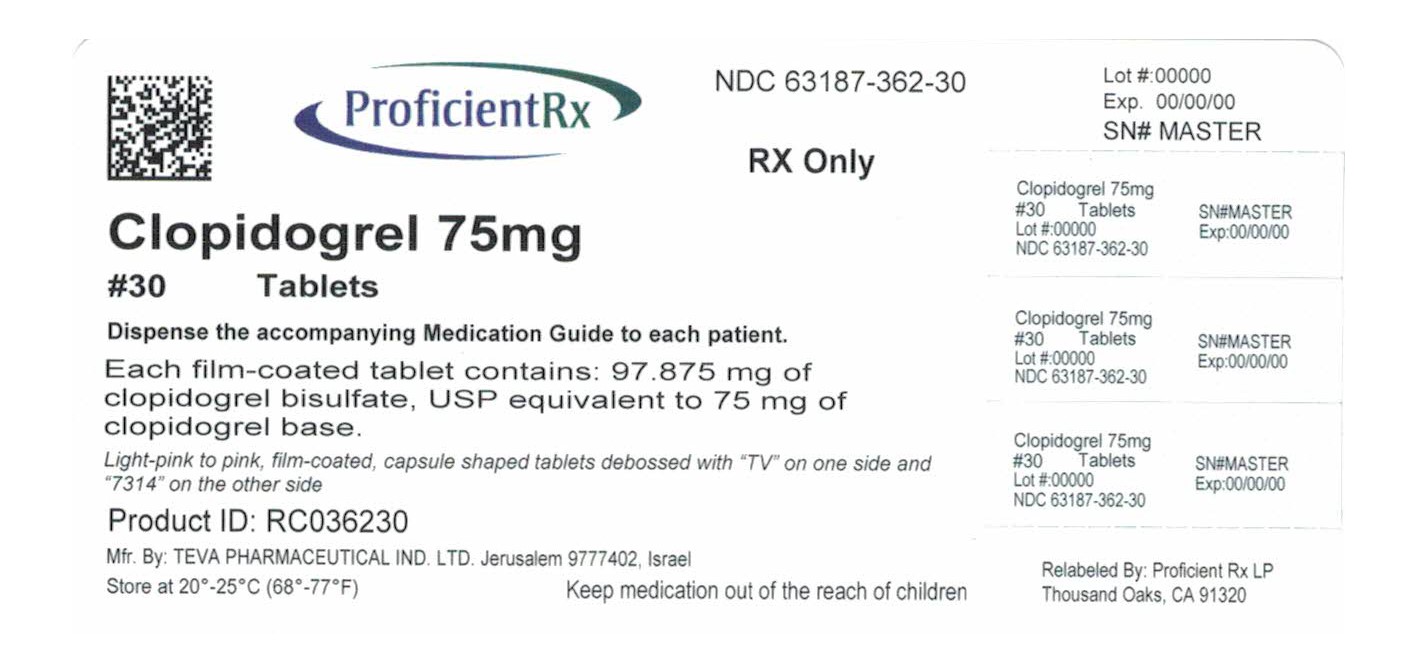
Label for Clopidogrel 75 mg film-coated tablets, package of 30 tablets, relabeled by Proficient Rx LP. The label shows the NDC 63187-362-30 and indicates the manufacturer as TEVA Pharmaceutical Industries Ltd., Jerusalem. Tablets are light pink to pink, capsule-shaped, debossed with 'TV' on one side and '7314' on the other. Storage instructions specify 20°-25°C (68°-77°F).*

* About these descriptions: Image descriptions on this page are generated by automated AI analysis of the product label images from the manufacturer's FDA label submission (SPL). They are provided for reference only and may contain errors or omissions. Always rely on the printed label itself and the official FDA labeling, and consult a pharmacist or healthcare professional with any questions about this product.