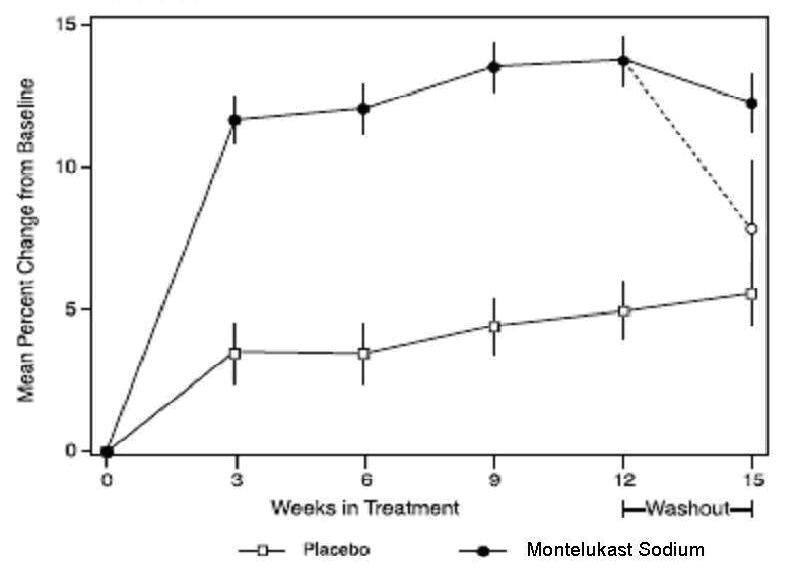
Chart (Montelukastir Figure 01)

This appears to be a graph depicting the "Change in Height" in centimeters over a period of "Weeks on Treatment" with Montelukast Sodium (with a sample size of 358) and Placebo (with a sample size of 121). The graph shows negative change in height (a decrease) in both groups over the course of the treatment. However, without additional context or information it is difficult to determine what the study was examining or what the findings ultimately mean.*