Terazosin Capsule
Product Images NDC 63187-456

5 FDA label images from Proficient Rx Lp · Packaging, Regulatory Labels, and Product Appearance

Product Visual Gallery

This gallery contains 5 technical images submitted to the FDA as part of the official labeling for Terazosin (NDC 63187-456). Unlike standard consumer photos, these assets often include clinical data figures, molecular chemical structures, and official manufacturer packaging layouts.

As provided by Proficient Rx Lp, these visuals offer a comprehensive scientific overview of the product's physical and chemical identity, aiding pharmacists and researchers in product verification and study.

FDA Label Image

Terazosin 5mg (Terazosin 2 mg)
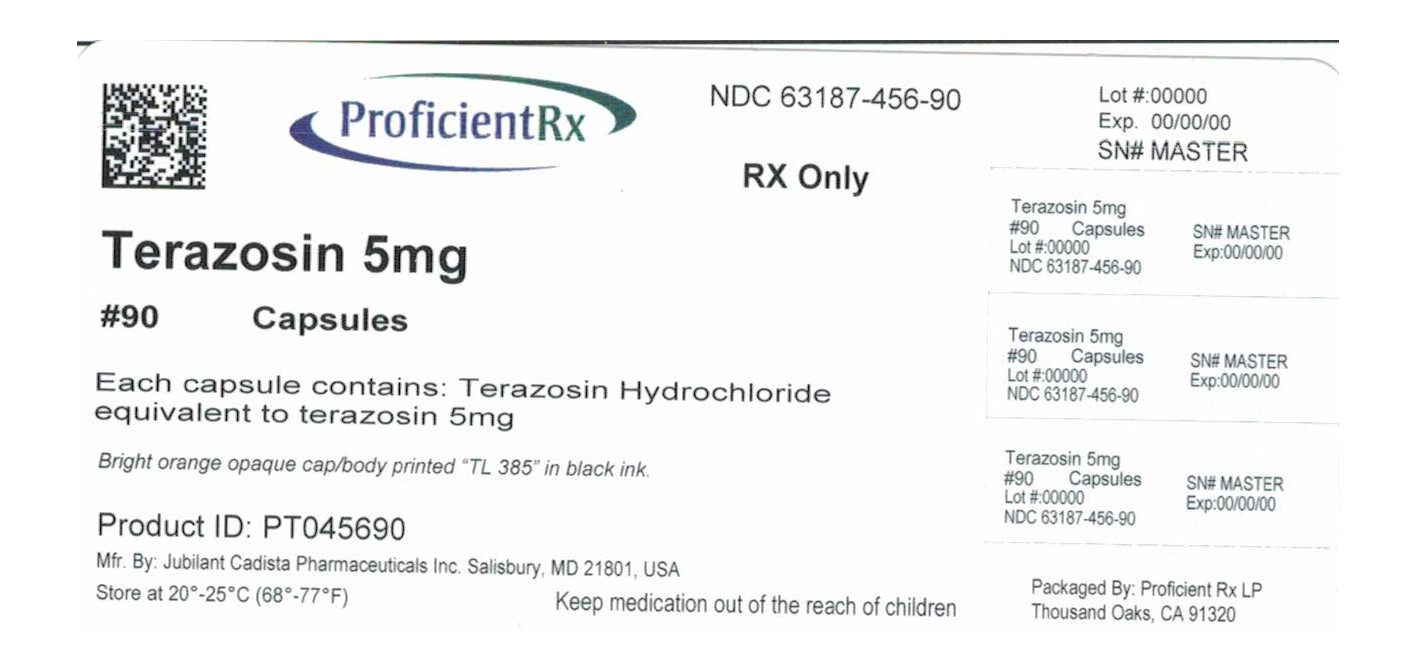
Terazosin 5mg (Terazosin 2 mg)
Label for Terazosin 5 mg capsules, containing Terazosin Hydrochloride equivalent to 5 mg terazosin per capsule. The label displays NDC 63187-456-90 and indicates a quantity of 90 capsules. It includes manufacturer information as Jubilant Cadista Pharmaceuticals Inc., Salisbury, MD, and packaging by Proficient Rx LP, Thousand Oaks, CA. Storage instructions specify 20°-25°C (68°-77°F).*
FDA Label Image

Terazosin Hydrochloride Chemical Structure (Terazosin Hydrochloride Capsules 1)

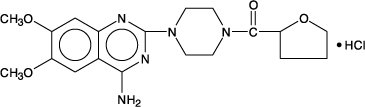
Terazosin Hydrochloride Chemical Structure (Terazosin Hydrochloride Capsules 1)
Chemical structure of Terazosin Hydrochloride, shown as a molecular diagram with labeled functional groups, illustrating its chemical composition and bonding arrangement.*
FDA Label Image

Figure 1 (Terazosin Hydrochloride Capsules 2)

Figure 1 (Terazosin Hydrochloride Capsules 2)
This image presents two line graphs comparing the effects of Terazosin and placebo over three months. The left graph shows the mean change in total symptom score from baseline, indicating a decrease for Terazosin. The right graph shows the mean increase in peak flow rate (mL/sec) from baseline, with Terazosin demonstrating a higher increase than placebo.*
FDA Label Image

Figure 2 (Terazosin Hydrochloride Capsules 3)

Figure 2 (Terazosin Hydrochloride Capsules 3)
A line graph showing the mean change from baseline over a 30-month period, with data points plotted at multiple months including 0, 1, 2, 3, 6, 9, 12, 15, 18, 21, 24, 27, and 30. The y-axis measures the mean change from baseline, ranging from 0 to -7. The data points show a downward trend that stabilizes over time, with several marked points indicating statistical significance.*
FDA Label Image

Figure 3 (Terazosin Hydrochloride Capsules 4)

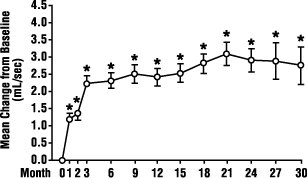
Figure 3 (Terazosin Hydrochloride Capsules 4)
A line chart depicting the mean change from baseline in urine volume (mL/sec) over a 30-month period. The x-axis shows months (0, 1, 2, 3, 6, 9, 12, 15, 18, 21, 24, 27, 30), and the y-axis represents the mean change from baseline ranging approximately from 0 to 4.5 mL/sec. Data points indicate an increase over time, with several marked significant changes.*

* About these descriptions: Image descriptions on this page are generated by automated AI analysis of the product label images from the manufacturer's FDA label submission (SPL). They are provided for reference only and may contain errors or omissions. Always rely on the printed label itself and the official FDA labeling, and consult a pharmacist or healthcare professional with any questions about this product.