Figure 1 (Monte Tab Alkem Figure 01)
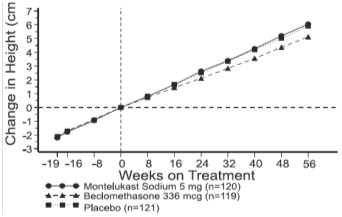
This appears to be a chart showing the change in height (measured in centimeters) over a period of weeks for three groups of participants (120 taking Monteukast Sodum & mg, 119 taking Bodiomeinasono 338 mg, and 121 taking a placebo). The chart displays data at weeks 8, 16, 21, 32, 40, 48, but it is not possible to draw conclusions without more context about the study being conducted.*