Figure_01 (Montelukast Fig1)

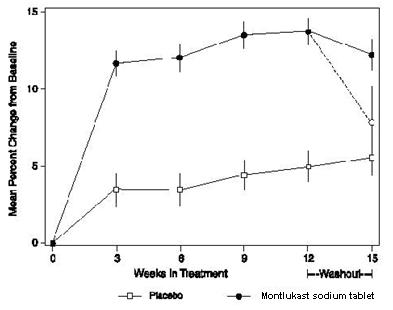
This is a graph showing the change in height (measured in cm) over a period of 56 weeks of administration of two medications - Montelukast sodium and Beclomethasone 336 mg. The graph does not show the standard errors of the treatment group means in change in height as the errors are too small to be visible on the plot.*