This Is The First Graph In The Insert (Graph1)
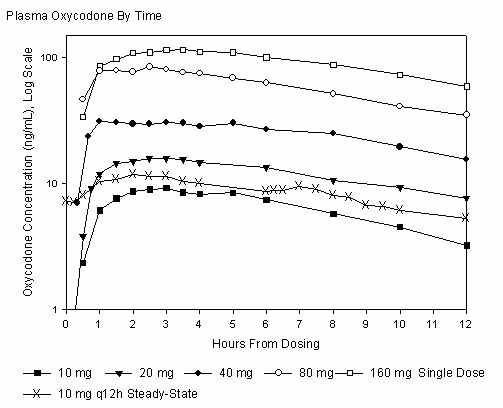
This is a graph titled "Plasma Oxycodone By Time" displaying the concentration of oxycodone (measured in nmol/L on a log scale) over a 12-hour period following dosing. The graph shows four different doses: 10mg, 20mg, 40mg, and 80mg (marked on the x-axis), with the 80mg dose represented by a filled-in circle. The graph also notes a steady-state concentration achieved after a 2-hour interval following a 10mg dosage.*