Dextromethorphan Hydrobromide And Quinidine Sulphate Capsule
Product Images NDC 63304-650

View Photos of Packaging, Regulatory Labels, and Product Appearance

Product Visual Gallery

This gallery contains 5 technical images submitted to the FDA as part of the official labeling for Dextromethorphan Hydrobromide And Quinidine Sulphate (NDC 63304-650). Unlike standard consumer photos, these assets often include clinical data figures, molecular chemical structures, and official manufacturer packaging layouts.

As provided by Sun Pharmaceutical Industries, Inc., these visuals offer a comprehensive scientific overview of the product's physical and chemical identity, aiding pharmacists and researchers in product verification and study.

FDA Label Image

Dextro Hbr Structural Formula (Dextro Hbr Structural Formula)
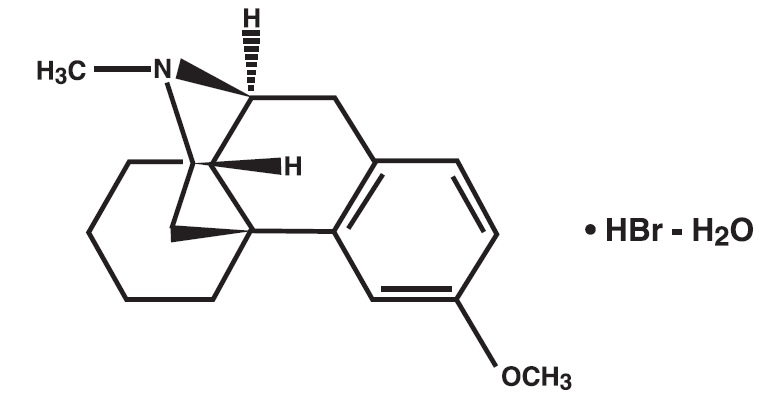
Dextro Hbr Structural Formula (Dextro Hbr Structural Formula)
Chemical structure diagram of Dextromethorphan Hydrobromide showing the molecular arrangement including a phenyl ring, methoxy group, and bicyclic system with specified hydrogen and methyl groups. The label also indicates the hydrobromide hydrate form (HBr - H2O).*
FDA Label Image

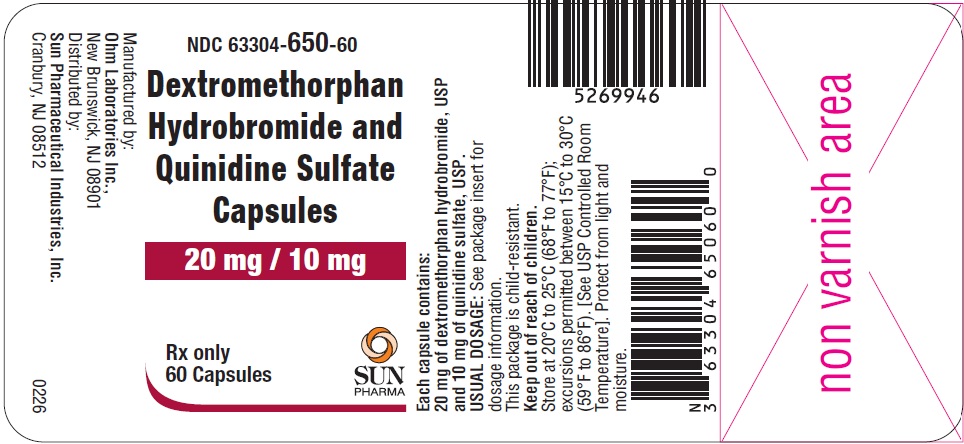
Dextro And Quinidine Caps Label (Dextro And Quinidine Caps Label)

Dextro And Quinidine Caps Label (Dextro And Quinidine Caps Label)
Label for Dextromethorphan Hydrobromide and Quinidine Sulfate capsules, 20 mg / 10 mg strength, oral capsule form. The package contains 60 capsules and is labeled Rx only. Manufactured by Ovation Laboratories, Inc. and distributed by Sun Pharmaceutical Industries, Inc. Barcodes and storage instructions are also visible.*
FDA Label Image

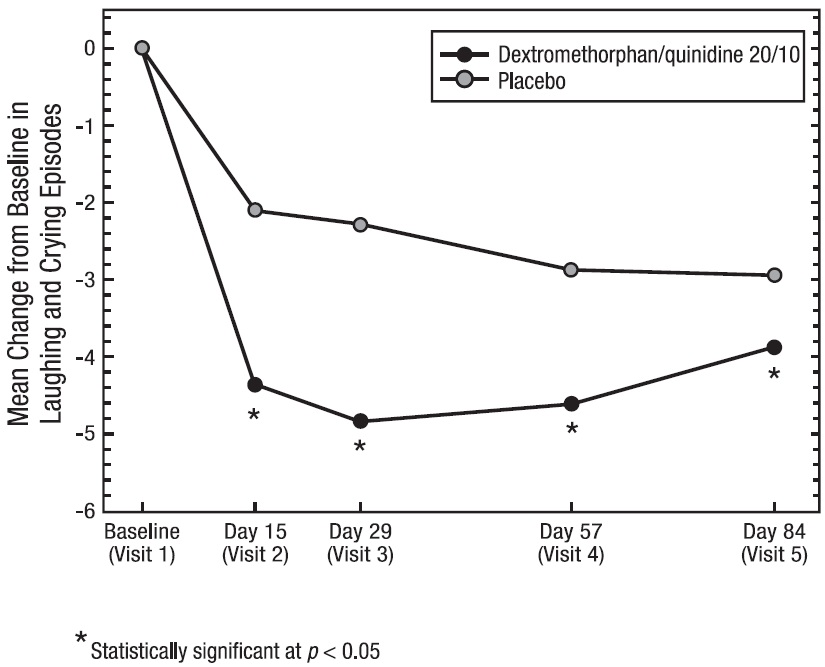
Figure 1 (Figure 1)

Figure 1 (Figure 1)
Line graph depicting the mean change from baseline in laughing and crying episodes over multiple visits (Baseline, Day 15, Day 29, Day 57, and Day 84) comparing Dextromethorphan/quinidine 20/10 mg to placebo. The y-axis represents the mean change, with multiple points indicating statistically significant differences (p < 0.05) favoring Dextromethorphan/quinidine.*
FDA Label Image

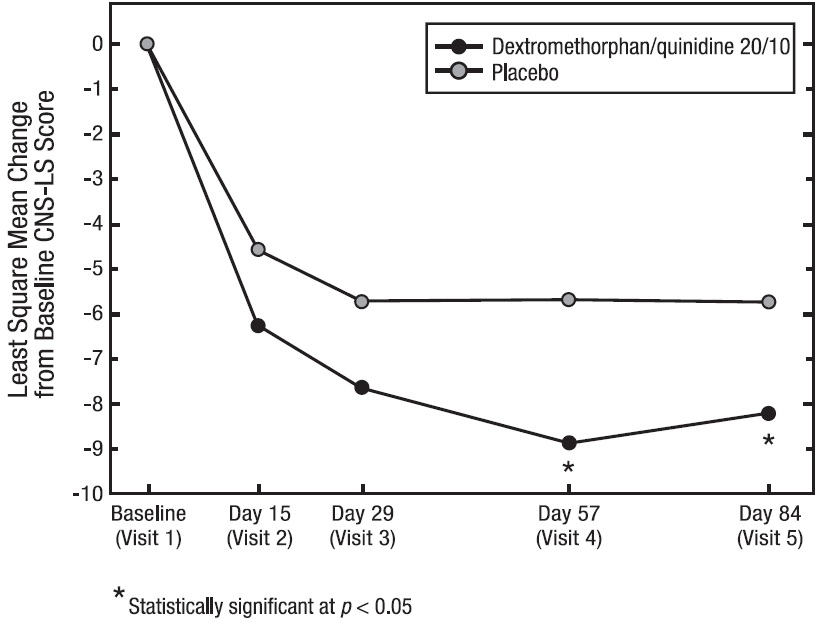
Figure 2 (Figure 2)

Figure 2 (Figure 2)
A line graph showing least square mean change from baseline CNS-LS score over five visits: Baseline (Visit 1), Day 15 (Visit 2), Day 29 (Visit 3), Day 57 (Visit 4), and Day 84 (Visit 5). The graph compares Dextromethorphan/quinidine 20/10 mg (black line) with placebo (gray line), indicating statistically significant differences at Day 57 and Day 84 (p < 0.05).*
FDA Label Image

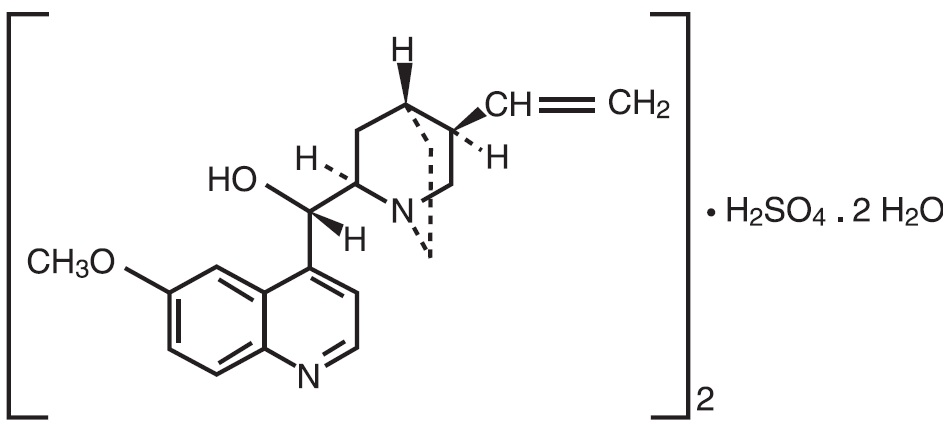
Quinidine Sulfate Structural Formula (Quinidine Sulfate Structural Formula)

Quinidine Sulfate Structural Formula (Quinidine Sulfate Structural Formula)
Chemical structure diagram of Dextromethorphan Hydrobromide and Quinidine Sulphate showing molecular bonds and atom groups, including sulfate and water components.*

* About these descriptions: Image descriptions on this page are generated by automated AI analysis of the product label images from the manufacturer's FDA label submission (SPL). They are provided for reference only and may contain errors or omissions. Always rely on the printed label itself and the official FDA labeling, and consult a pharmacist or healthcare professional with any questions about this product.