Midazolam Injection, Solution
Product Images NDC 63323-412

7 FDA label images from Fresenius Kabi Usa, Llc · Packaging, Regulatory Labels, and Product Appearance

Product Visual Gallery

This gallery contains 7 technical images submitted to the FDA as part of the official labeling for Midazolam (NDC 63323-412). Unlike standard consumer photos, these assets often include clinical data figures, molecular chemical structures, and official manufacturer packaging layouts.

As provided by Fresenius Kabi Usa, Llc, these visuals offer a comprehensive scientific overview of the product's physical and chemical identity, aiding pharmacists and researchers in product verification and study.

FDA Label Image

Carton (Carton 621456a)

Carton (Carton 621456a)
Midazolam Injection USP 5 mg/mL (500 mg per 100 mL) vial label from Fresenius Kabi USA, LLC. The label indicates it is a pharmacy bulk package not for direct infusion, sterile, for intramuscular and intravenous use, and contains benzyl alcohol. It is marked Rx only.*
FDA Label Image

Class (Class Iv)

FDA Label Image
FDA Label Image

Structure (Midazolam Stru)

Structure (Midazolam Stru)
Chemical structure diagram of Midazolam hydrochloride showing its molecular arrangement, including chlorine and fluorine substituents on aromatic rings, and nitrogen-containing heterocyclic rings.*
FDA Label Image

Vial (Midazolam Vlbl)

Vial (Midazolam Vlbl)
Midazolam Injection USP 5 mg/mL label for a 500 mg per 100 mL pharmacy bulk package. The label states that the product is sterile, for intramuscular and intravenous use, contains benzyl alcohol, and is Rx only. The labeler is Fresenius Kabi USA, LLC.*
FDA Label Image

Open Ring (Openring Stru)

Open Ring (Openring Stru)
Chemical structure diagram depicting Midazolam and its open-ring form. The illustration shows molecular configurations with labeled chemical groups, indicating the reversible conversion between the two forms.*
FDA Label Image

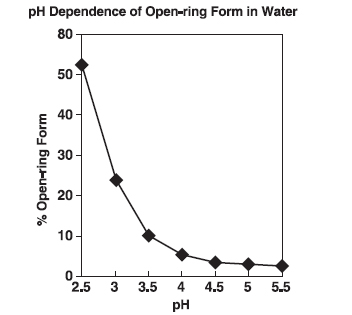
Ph Fig (Ph Fig)

Ph Fig (Ph Fig)
A line graph titled 'pH Dependence of Open-ring Form in Water' showing the percentage of open-ring form on the y-axis and pH values from 2.5 to 5.5 on the x-axis. The graph depicts a decreasing trend, with the percentage of open-ring form dropping sharply as pH increases from 2.5 to about 4, then stabilizing near zero from pH 4 to 5.5.*

* About these descriptions: Image descriptions on this page are generated by automated AI analysis of the product label images from the manufacturer's FDA label submission (SPL). They are provided for reference only and may contain errors or omissions. Always rely on the printed label itself and the official FDA labeling, and consult a pharmacist or healthcare professional with any questions about this product.