Guanfacine
Product Images NDC 63629-1102

View Photos of Packaging, Regulatory Labels, and Product Appearance

Product Visual Gallery

This gallery contains 6 technical images submitted to the FDA as part of the official labeling for Guanfacine (NDC 63629-1102). Unlike standard consumer photos, these assets often include clinical data figures, molecular chemical structures, and official manufacturer packaging layouts.

As provided by Bryant Ranch Prepack, these visuals offer a comprehensive scientific overview of the product's physical and chemical identity, aiding pharmacists and researchers in product verification and study.

FDA Label Image

Figure1 (Image 05)

Figure1 (Image 05)
A line graph comparing guanfacine plasma concentration (ng/mL) over 24 hours (time in hours) for guanfacine extended-release tablets 1 mg QD and Tenex 1 mg QD. The graph shows plasma concentration on the vertical axis and time on the horizontal axis, with distinct curves for each formulation.*
FDA Label Image

Figure 2 (Image 06)

Figure 2 (Image 06)
A forest plot chart depicting the fold change and 90% confidence intervals in pharmacokinetic parameters (Cmax and AUC) of Guanfacine related to various substances including CYP3A4/5 inhibitors (Ketoconazole), Fluconazole, CYP3A4 inducers (Rifampin), Efavirenz, Oral Methylphenidate, and Lisdexamfetamine Dimesylate. The x-axis represents change relative to reference, ranging from 0 to 5 fold change.*
FDA Label Image

Figure 3 (Image 07)

Figure 3 (Image 07)
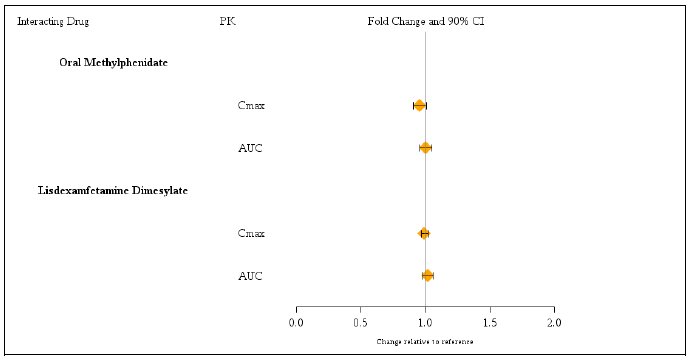
A horizontal error bar chart depicting fold change and 90% confidence intervals in pharmacokinetics (Cmax and AUC) for two interacting drugs, Oral Methylphenidate and Lisdexamfetamine Dimesylate, relative to reference values. The x-axis shows change relative to reference, ranging from 0.0 to 2.0.*
FDA Label Image

Label (Lbl636291102)

Label (Lbl636291102)
Label for Guanfacine Extended-Release Tablets, USP 1 mg by Bryant Ranch Prepack. The label includes the NDC 63629-1102-1, a barcode, manufacturer information (Ohm Laboratories Inc.), and states the package contains 100 tablets. Storage, safety, and dispensing instructions are also present.*
FDA Label Image

Spl-guanfacine-figure 4 (Spl Guanfacine Figure 4)

Spl-guanfacine-figure 4 (Spl Guanfacine Figure 4)
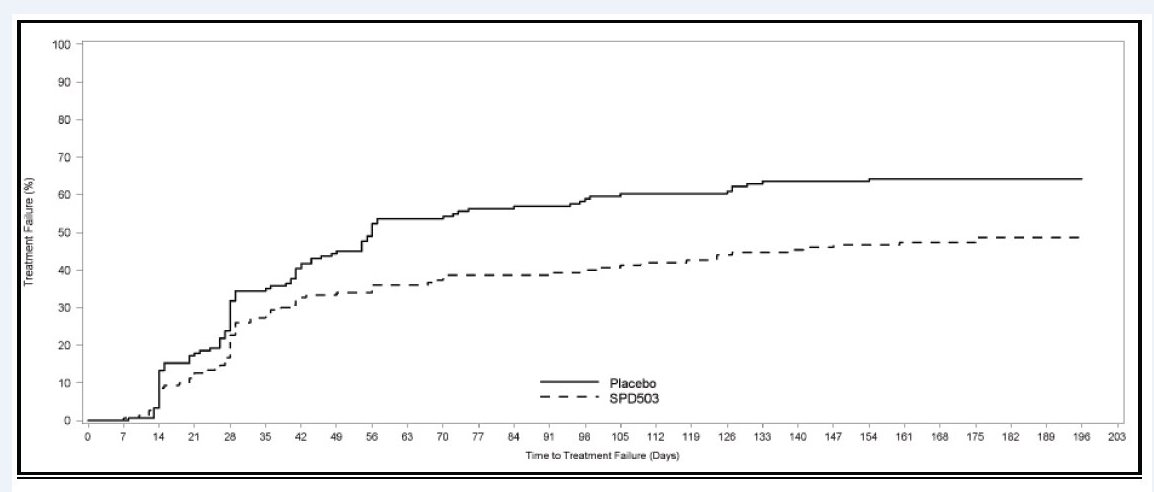
A line graph showing treatment failure percentage over time in days, comparing two groups: Placebo (solid line) and SPD503 (dashed line). The x-axis represents time to treatment failure in days, ranging from 0 to over 200 days. The y-axis represents treatment failure percentage from 0% to 100%. The graph illustrates higher treatment failure for Placebo compared to SPD503 over time.*
FDA Label Image

Structure (Structure)

Structure (Structure)
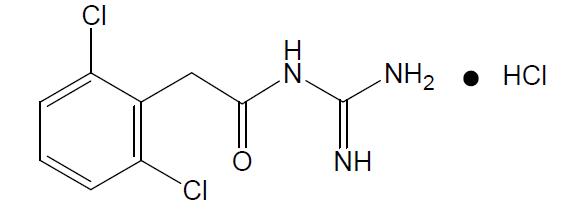
Chemical structure of Guanfacine hydrochloride showing its molecular composition including two chlorine atoms, an amide group, and an imidazoline ring structure.*

* About these descriptions: Image descriptions on this page are generated by automated AI analysis of the product label images from the manufacturer's FDA label submission (SPL). They are provided for reference only and may contain errors or omissions. Always rely on the printed label itself and the official FDA labeling, and consult a pharmacist or healthcare professional with any questions about this product.