Figure-1 (Image 01)
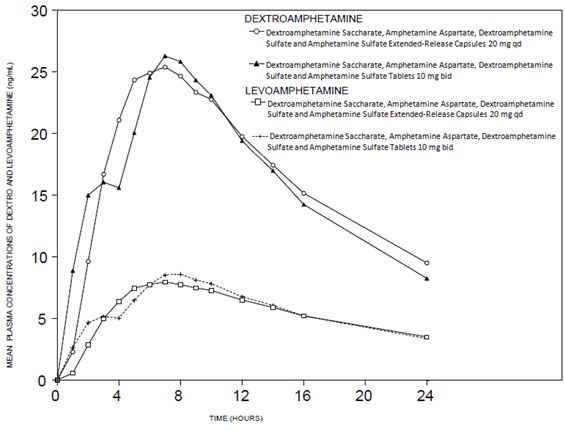
This appears to be a table showing mean plasma concentrations of Dextro and Levoamphetamine, with measurements in ngint. The table appears to have two columns, one for each type of amphetamine, and six rows showing the concentration in decreasing order from 30 to 10. The text below the table contains some garbled words, but they appear to relate to the names and properties of the two types of amphetamines.*
