Figure-1 (Image 01)
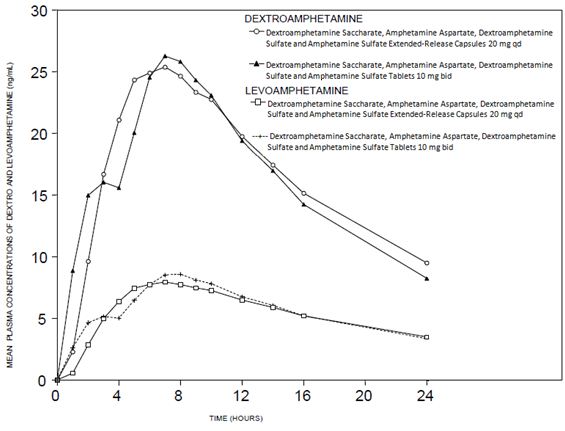
This is a table displaying the mean plasma concentrations of dextro and levoamphetamine, measured in ngint. The x-axis shows the time points (in hours), and the y-axis shows the concentrations (ranging from 0 to 30 ngint). There are some misspelled drug names and garbled text throughout, but the overall information is clear.*