Figure-1 (Image 01)
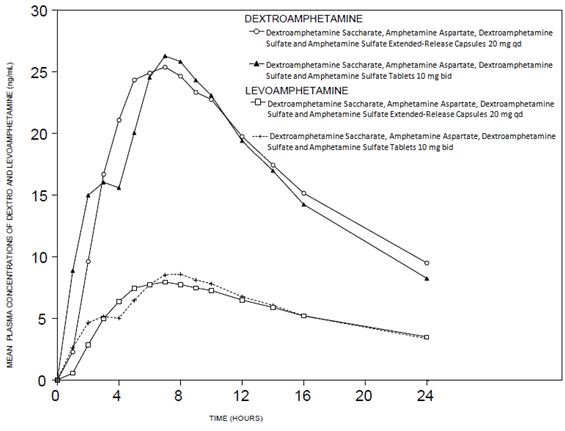
This appears to be a table showing mean plasma concentrations of Dextro and Levoamphetamine in ngint. The table has columns for time periods and rows for each type of Amphetamine. However, the has made some errors and there are some confusing text that doesn't make sense. Therefore, the text contains some garbage characters and incomplete words, making it difficult to interpret.*