Product Images Oxcarbazepine

View Photos of Packaging, Labels & Appearance

Product Label Images

The following 6 images provide visual information about the product associated with Oxcarbazepine NDC 63629-2075 by Bryant Ranch Prepack, such as packaging, labeling, and the appearance of the drug itself. This resource could be helpful for medical professionals, pharmacists, and patients seeking to verify medication information and ensure they have the correct product.

Label - lbl636292075

Label - lbl636292075

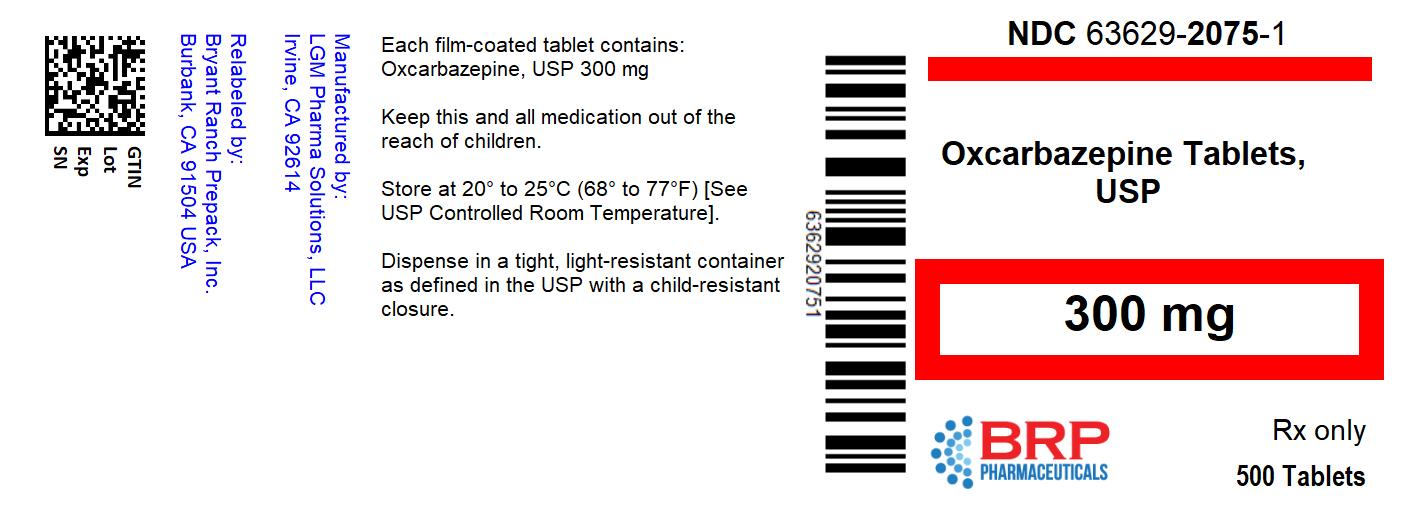
This is a prescription medicine called Oxcarbazepine Tablets, USP which comes in the strength of 300mg. The medicine should be kept safely away from children and stored at a temperature range of 20 degrees Celsius to 25 degrees Celsius. It should be dispensed in a tightly closed light-resistant container that comes with a child-resistant cap. The NDC (National Drug Code) for this medication is 63629-2075-1.*

Chemical Structure - oxcarbazepine 01

Chemical Structure - oxcarbazepine 01

Figure 1 - oxcarbazepine 02

Figure 1 - oxcarbazepine 02

This text appears to be a graph displaying the exit rate over time on a trial, specifically examining the results from Day 2 to Day 11. The log-rank test was used with a p-value of 0.0001. The graph includes a reference to a placebo.*

Figure 2 - oxcarbazepine 03

Figure 2 - oxcarbazepine 03

The text presents the results of a study on the seizure rate using oxcarbazepine and placebo treatments. A log-rank test was used to analyze the data, and the obtained p-value is 0.046, suggesting that there is a significant difference between the treatment groups. The graph shows the number of days between the first dose and the first seizure for both treatments, where the Oxcarbazepine group had fewer seizures overall.*

Figure 3 - oxcarbazepine 04

Figure 3 - oxcarbazepine 04

This appears to be a statistical output of a log-rank test comparing two groups, a HIGH treatment group and a LOW treatment group, based on time to exit in days. The p-value is 0.0001, indicating a statistically significant difference between the two groups. The other characters seem to be errors and are not readable.*

Figure 4 - oxcarbazepine 05

Figure 4 - oxcarbazepine 05

This appears to be the result of a survival analysis, showing the exit rate, log-rank test p-value, and time to exit in days for a treatment group labeled "HIGH" and another labeled "LOW". Not much other information is available.*

* The product label images have been analyzed using a combination of traditional computing and machine learning techniques. It should be noted that the descriptions provided may not be entirely accurate as they are experimental in nature. Use the information in this page at your own discretion and risk.