Tamsulosin Hydrochloride Capsule
Product Images NDC 63629-4346

View Photos of Packaging, Regulatory Labels, and Product Appearance

Product Visual Gallery

This gallery contains 7 technical images submitted to the FDA as part of the official labeling for Tamsulosin Hydrochloride (NDC 63629-4346). Unlike standard consumer photos, these assets often include clinical data figures, molecular chemical structures, and official manufacturer packaging layouts.

As provided by Bryant Ranch Prepack, these visuals offer a comprehensive scientific overview of the product's physical and chemical identity, aiding pharmacists and researchers in product verification and study.

FDA Label Image

Ee9d9efd 0c79 4993 Bfd7 D4c30e20bddd 01

Ee9d9efd 0c79 4993 Bfd7 D4c30e20bddd 01
Chemical structure of Tamsulosin Hydrochloride, showing its molecular framework including aromatic rings, functional groups, and the hydrochloride salt notation.*
FDA Label Image

Ee9d9efd 0c79 4993 Bfd7 D4c30e20bddd 02

Ee9d9efd 0c79 4993 Bfd7 D4c30e20bddd 02
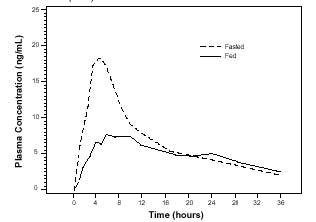
A pharmacokinetic curve showing plasma concentration (mg/mL) versus time (hours) for Tamsulosin Hydrochloride capsules. The graph compares plasma levels under fasted and fed conditions over a 36-hour period, illustrating differences in drug absorption profiles between the two states.*
FDA Label Image

Ee9d9efd 0c79 4993 Bfd7 D4c30e20bddd 03

Ee9d9efd 0c79 4993 Bfd7 D4c30e20bddd 03
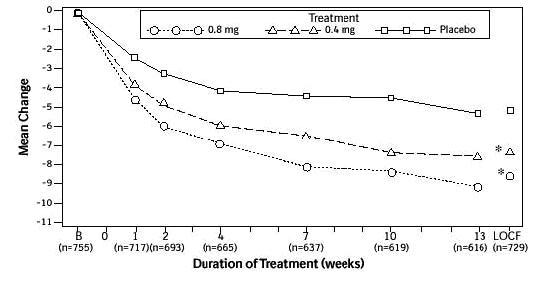
A line graph showing mean change versus duration of treatment in weeks up to 13 weeks for Tamsulosin Hydrochloride capsules at 0.4 mg and 0.8 mg doses compared to placebo. The graph includes treatment and placebo groups with sample sizes noted at intervals. Both treatment doses show greater mean change over time compared to placebo.*
FDA Label Image

Ee9d9efd 0c79 4993 Bfd7 D4c30e20bddd 04

Ee9d9efd 0c79 4993 Bfd7 D4c30e20bddd 04
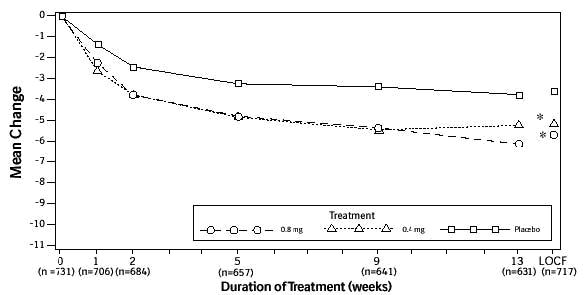
A line graph showing mean change over time (in weeks) for three groups: 0.8 mg dosage, 0.4 mg dosage, and placebo. The x-axis represents duration of treatment from 0 to 13 weeks, while the y-axis shows mean change values. Each group is indicated with different markers (circles, triangles, squares) and a legend is provided. Sample sizes at various time points are noted along the x-axis.*
FDA Label Image

Ee9d9efd 0c79 4993 Bfd7 D4c30e20bddd 05

Ee9d9efd 0c79 4993 Bfd7 D4c30e20bddd 05
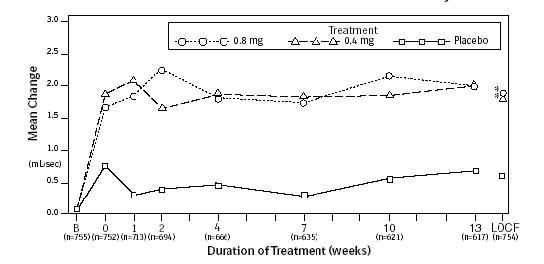
A line graph depicting the mean change in a measured variable (mL/sec) over a treatment duration of up to 14 weeks. The graph compares three groups: Treatment with 0.8 mg, Treatment with 0.4 mg, and a Placebo group. The x-axis shows duration of treatment in weeks, with sample sizes for each time point. The y-axis shows the mean change in mL/sec, ranging from 0 to 3.0.*
FDA Label Image

Ee9d9efd 0c79 4993 Bfd7 D4c30e20bddd 06

Ee9d9efd 0c79 4993 Bfd7 D4c30e20bddd 06
A line graph showing mean change in mL/sec over duration of treatment weeks for different treatments with Tamsulosin Hydrochloride. The graph compares 0.8 mg, 0.4 mg doses, and placebo across several weeks, illustrating their effects on the measured variable during the treatment period.*
FDA Label Image

Label Image (Lbl636294346)

Label Image (Lbl636294346)
Label for Tamsulosin Hydrochloride Capsules, USP 0.4 mg, oral capsules in a 30-capsule package. The label includes storage instructions (store at 20° to 25°C), warnings to keep out of reach of children, and dispensing instructions. The product is repackaged by Bryant Ranch Prepack, Inc. and manufactured by Zydus Lifesciences Ltd. The NDC is 63629-4346-1.*

* About these descriptions: Image descriptions on this page are generated by automated AI analysis of the product label images from the manufacturer's FDA label submission (SPL). They are provided for reference only and may contain errors or omissions. Always rely on the printed label itself and the official FDA labeling, and consult a pharmacist or healthcare professional with any questions about this product.