Alogliptin Tablet, Film Coated
Product Images NDC 63629-4946

View Photos of Packaging, Regulatory Labels, and Product Appearance

Product Visual Gallery

This gallery contains 7 technical images submitted to the FDA as part of the official labeling for Alogliptin (NDC 63629-4946). Unlike standard consumer photos, these assets often include clinical data figures, molecular chemical structures, and official manufacturer packaging layouts.

As provided by Bryant Ranch Prepack, these visuals offer a comprehensive scientific overview of the product's physical and chemical identity, aiding pharmacists and researchers in product verification and study.

FDA Label Image

Chemical Structure (Alogliptin 01)

Chemical Structure (Alogliptin 01)
Chemical structure diagram representing the active ingredient Alogliptin, including a depiction of its molecular groups and a phenylacetic acid moiety, as shown in the image.*
FDA Label Image

Figure 1 (Alogliptin 02)

Figure 1 (Alogliptin 02)
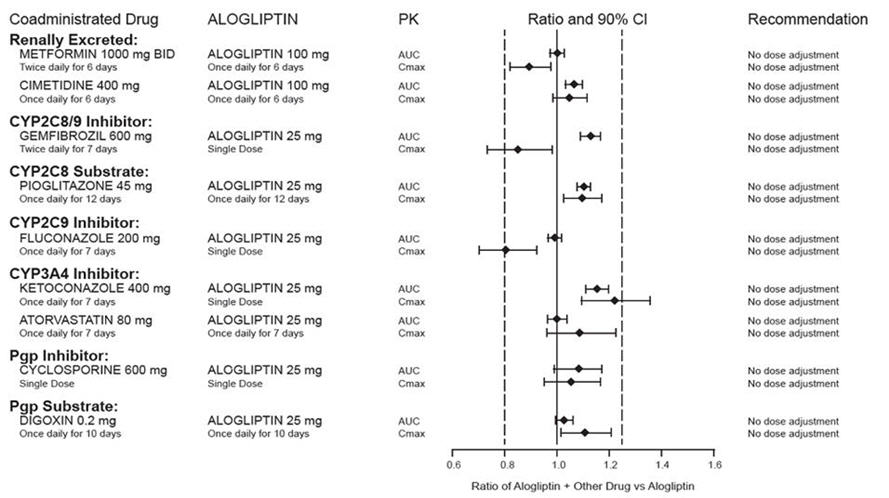
A chart displaying pharmacokinetic drug interaction data for Alogliptin with various coadministered drugs. It lists drug substrates by enzyme pathways, the corresponding doses and durations, and shows the ratios with 90% confidence intervals of Alogliptin plus other drugs versus other drugs alone for AUC and Cmax parameters. The chart includes a recommendation column stating no dose adjustment is needed for any listed interactions.*
FDA Label Image

Figure 2 (Alogliptin 03)

Figure 2 (Alogliptin 03)
A pharmacokinetic chart displaying the ratio and 90% confidence interval of Alogliptin when coadministered with various drugs compared to Alogliptin alone. The chart includes drugs categorized by renal excretion, CYP inhibitors and substrates, and P-glycoprotein inhibitors and substrates, with data points showing area under the curve (AUC) and maximum concentration (Cmax). Recommendations indicate no dose adjustment is needed for any coadministered drug.*
FDA Label Image

Figure 3 (Alogliptin 04)

Figure 3 (Alogliptin 04)
Bar chart showing least squares mean change in A1C percentage for treatment groups: Placebo, Alogliptin 25 mg, Pioglitazone 15 mg/30 mg/45 mg, and combinations of Alogliptin 25 mg with Pioglitazone doses. The chart compares baseline mean A1C levels and shows greater A1C reduction with combination therapy versus individual drugs or placebo.*
FDA Label Image

Figure 4 (Alogliptin 05)

Figure 4 (Alogliptin 05)
A Kaplan-Meier plot showing the cumulative event probability over 30 months from randomization. It compares two groups labeled Placebo (P) with a solid line and NESINA (N) with a dotted line. Below the x-axis, the table shows the number of patients at risk at different time points for both groups. The hazard ratio (HR) with 95% confidence interval (CI) is displayed as 0.96 (0.80, 1.16).*
FDA Label Image

Label (Lbl636294946)

Label (Lbl636294946)
Label for Alogliptin Tablets 25 mg film-coated oral tablets, NDC 63629-4946-1. The bottle contains 30 tablets. The product is relabeled by Bryant Ranch Prepack, Inc., Burbank, CA, and manufactured by Takeda Pharmaceuticals USA Inc. Storage and usage instructions are also included, along with two QR codes likely linking to additional information and the package insert.*
FDA Label Image

* About these descriptions: Image descriptions on this page are generated by automated AI analysis of the product label images from the manufacturer's FDA label submission (SPL). They are provided for reference only and may contain errors or omissions. Always rely on the printed label itself and the official FDA labeling, and consult a pharmacist or healthcare professional with any questions about this product.