Product Images Duloxetine

View Photos of Packaging, Labels & Appearance

Product Label Images

The following 11 images provide visual information about the product associated with Duloxetine NDC 63629-5174 by Bryant Ranch Prepack, such as packaging, labeling, and the appearance of the drug itself. This resource could be helpful for medical professionals, pharmacists, and patients seeking to verify medication information and ensure they have the correct product.

lbl636295174

lbl636295174

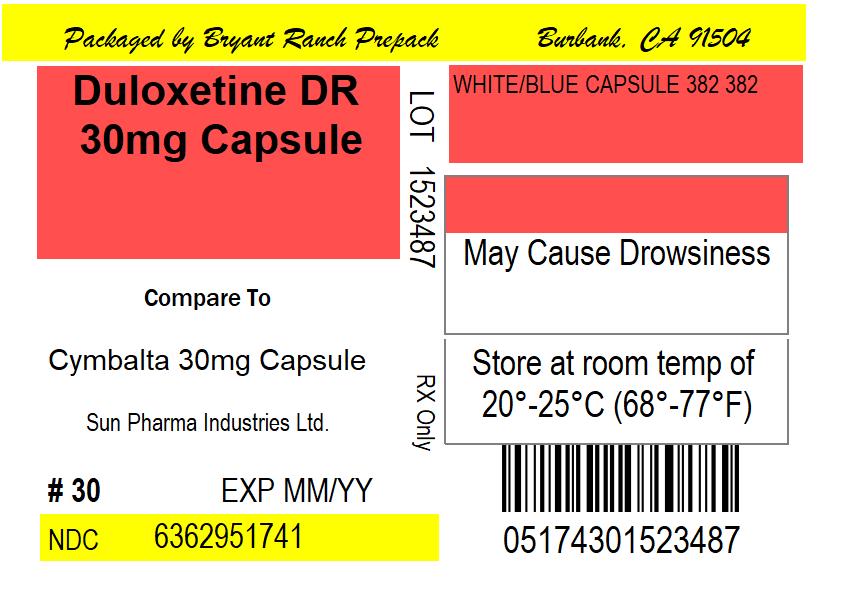
This appears to be a product label or packaging information for a medication called "Cymbalta 30mg Capsule" manufactured by "Sun Pharma Industries Ltd." The packaging was prepared by an individual named Bryant Ranck under the name "Prepack." The package includes a warning that the medication may cause drowsiness and should be stored at room temperature. The label contains a National Drug Code (NDC) of 6362951741 and an expiration date of MM/YY which is not provided in the text.*

spl duloxetine figure1

spl duloxetine figure1

This chart shows the proportion of patients having a relapse after receiving treatment for a certain period of time. The time from randomization to relapse is measured in days and ranges from 0 to 250. The treatment type is not specified.*

spl duloxetine figure10

spl duloxetine figure10

This text appears to be a graph showing the percentage improvement in pain from baseline for two different treatments. One treatment is labeled as "Placebo" and the other is "Duloxetine 60 mg/120 mg once daily". The x-axis shows different time intervals (0, 10, 20, 23, 40, 50, 260, 70, 80, and 200) and the y-axis shows the percentage improvement in pain from baseline using BOCF (Baseline Observed Carried Forward) analysis.*

spl duloxetine figure2

spl duloxetine figure2

This appears to be a graph depicting the proportion of patients with a relapse in a study comparing a treatment of Placebo vs Dulosetine over a period of time (measured in days) from randomization. The y-axis displays the proportion of patients on a scale of 0 to 8. The x-axis displays a time scale, with intervals marked from 50 to 300.*

spl duloxetine figure3

spl duloxetine figure3

The text is describing a chart that shows the percentage of patients who experienced improvement in pain levels after treatment. The chart also displays the percent improvement in pain from a baseline measurement. Unfortunately, the did not capture a clear image of the chart, so the data may not be very useful.*

spl duloxetine figure4

spl duloxetine figure4

spl duloxetine figure5

spl duloxetine figure5

spl duloxetine figure6

spl duloxetine figure6

spl duloxetine figure8

spl duloxetine figure8

This appears to be a table showing the percentage of patents who experienced improvements in pain from a baseline (measured using the 80CF scale) in relation to a placebo and duloxetine medication taken once daily in doses of 60/120mg. The exact details of the table are not clear, but it seems to be related to medical research or clinical trials.*

spl duloxetine figure9

spl duloxetine figure9

This appears to be a graph showing the "Percent improvement in Pain from Baseline (80CF)" between a Placebo and Duloxetine 60 mg once daily. The x-axis ranges from 210 to 280, and the y-axis ranges from 0 to 100. The graph shows the percentage of patients improved, with Duloxetine outperforming the Placebo.*

spl duloxetine structure

spl duloxetine structure

* The product label images have been analyzed using a combination of traditional computing and machine learning techniques. It should be noted that the descriptions provided may not be entirely accurate as they are experimental in nature. Use the information in this page at your own discretion and risk.