Duloxetine
Product Images NDC 63629-5202

View Photos of Packaging, Regulatory Labels, and Product Appearance

Product Visual Gallery

This gallery contains 11 technical images submitted to the FDA as part of the official labeling for Duloxetine (NDC 63629-5202). Unlike standard consumer photos, these assets often include clinical data figures, molecular chemical structures, and official manufacturer packaging layouts.

As provided by Bryant Ranch Prepack, these visuals offer a comprehensive scientific overview of the product's physical and chemical identity, aiding pharmacists and researchers in product verification and study.

FDA Label Image

Lbl636295202

Lbl636295202
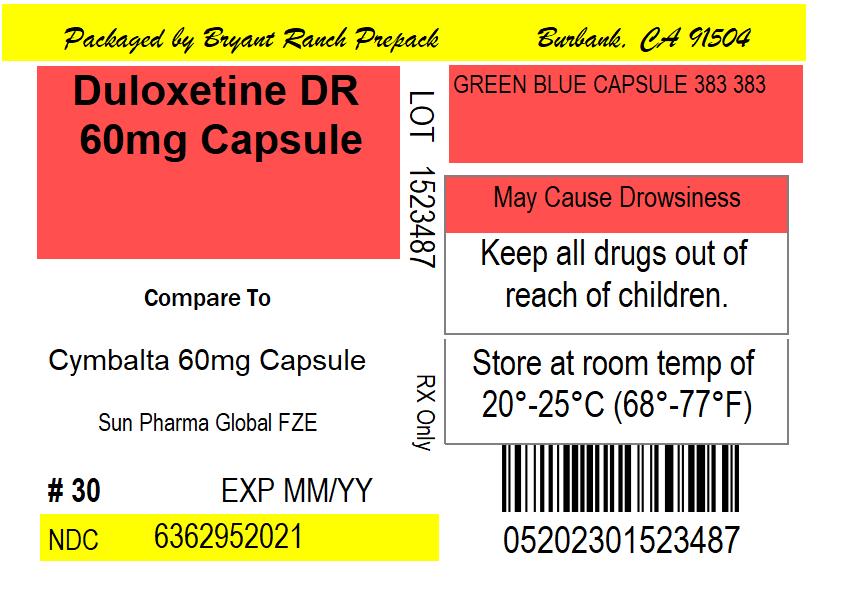
This appears to be a label or packaging information for a medication. The medication name is not available as it is not mentioned in the given text. It is packaged by Bryant Ranck Prepack and is being compared to Cymbalta 60mg Capsule manufactured by Sun Pharma Global FZE. The package contains 30 capsules and the expiration is mentioned as MM/YY (month/year). It also has an NDC number. The rest of the text contains storage instructions and a cautionary message to keep drugs out of reach of children.*
FDA Label Image

Spl Duloxetine Figure1

Spl Duloxetine Figure1
This appears to be a graph showing the proportion of patients with relapse over time from randomization to relapse. The x-axis represents the time in days, and the y-axis represents the percentage of patients who experienced relapse at that time point. The graph appears to show that as time from randomization to relapse increases, the proportion of patients experiencing relapse decreases. There are three lines on the graph, each representing a different treatment group, though the actual treatments are not specified in the available text.*
FDA Label Image

Spl Duloxetine Figure10

Spl Duloxetine Figure10
The text describes the percentage improvement in pain from baseline for patients taking either placebo or different dosages of a drug called Duloxetine. Dosages vary from 60mg to 120mg, and the drug is taken once daily. The chart provided shows the percentage of pain improvement at different time points and doses.*
FDA Label Image

Spl Duloxetine Figure2

Spl Duloxetine Figure2
This is a graph that shows the proportion of patients with relapse over time from randomization to relapse (measured in days) for a specific treatment (duloxetine) compared to a placebo. The graph displays the percentage of patients with relapse on the y-axis and time in days on the x-axis. The treatment group appears to have a lower proportion of patients with relapse over the observed time period compared to the placebo group.*
FDA Label Image

Spl Duloxetine Figure3

Spl Duloxetine Figure3
This appears to be a chart showing the percentage of patients who have improved in pain, with the x-axis representing the percentage improvement in pain from baseline and the y-axis representing the percentage of patients improved. It is not possible to discern any additional information without further context or data.*
FDA Label Image

Spl Duloxetine Figure4

FDA Label Image

Spl Duloxetine Figure5

FDA Label Image

Spl Duloxetine Figure6

FDA Label Image

Spl Duloxetine Figure8

FDA Label Image

Spl Duloxetine Figure9

Spl Duloxetine Figure9
This appears to be a chart displaying the percentage improvement in pain from baseline for a placebo and Duloxetine 60mg taken daily. There are various data points on the chart ranging from 210 to 280, with corresponding percentage improvements in pain indicated.*
FDA Label Image

Spl Duloxetine Structure

* These product label images have been analyzed using experimental machine learning. Please verify findings with the primary label text.