Quetiapine Tablet, Extended Release
Product Images NDC 63629-5944

View Photos of Packaging, Regulatory Labels, and Product Appearance

Product Visual Gallery

This gallery contains 5 technical images submitted to the FDA as part of the official labeling for Quetiapine (NDC 63629-5944). Unlike standard consumer photos, these assets often include clinical data figures, molecular chemical structures, and official manufacturer packaging layouts.

As provided by Bryant Ranch Prepack, these visuals offer a comprehensive scientific overview of the product's physical and chemical identity, aiding pharmacists and researchers in product verification and study.

FDA Label Image

Label (Lbl636295944)
Label (Lbl636295944)
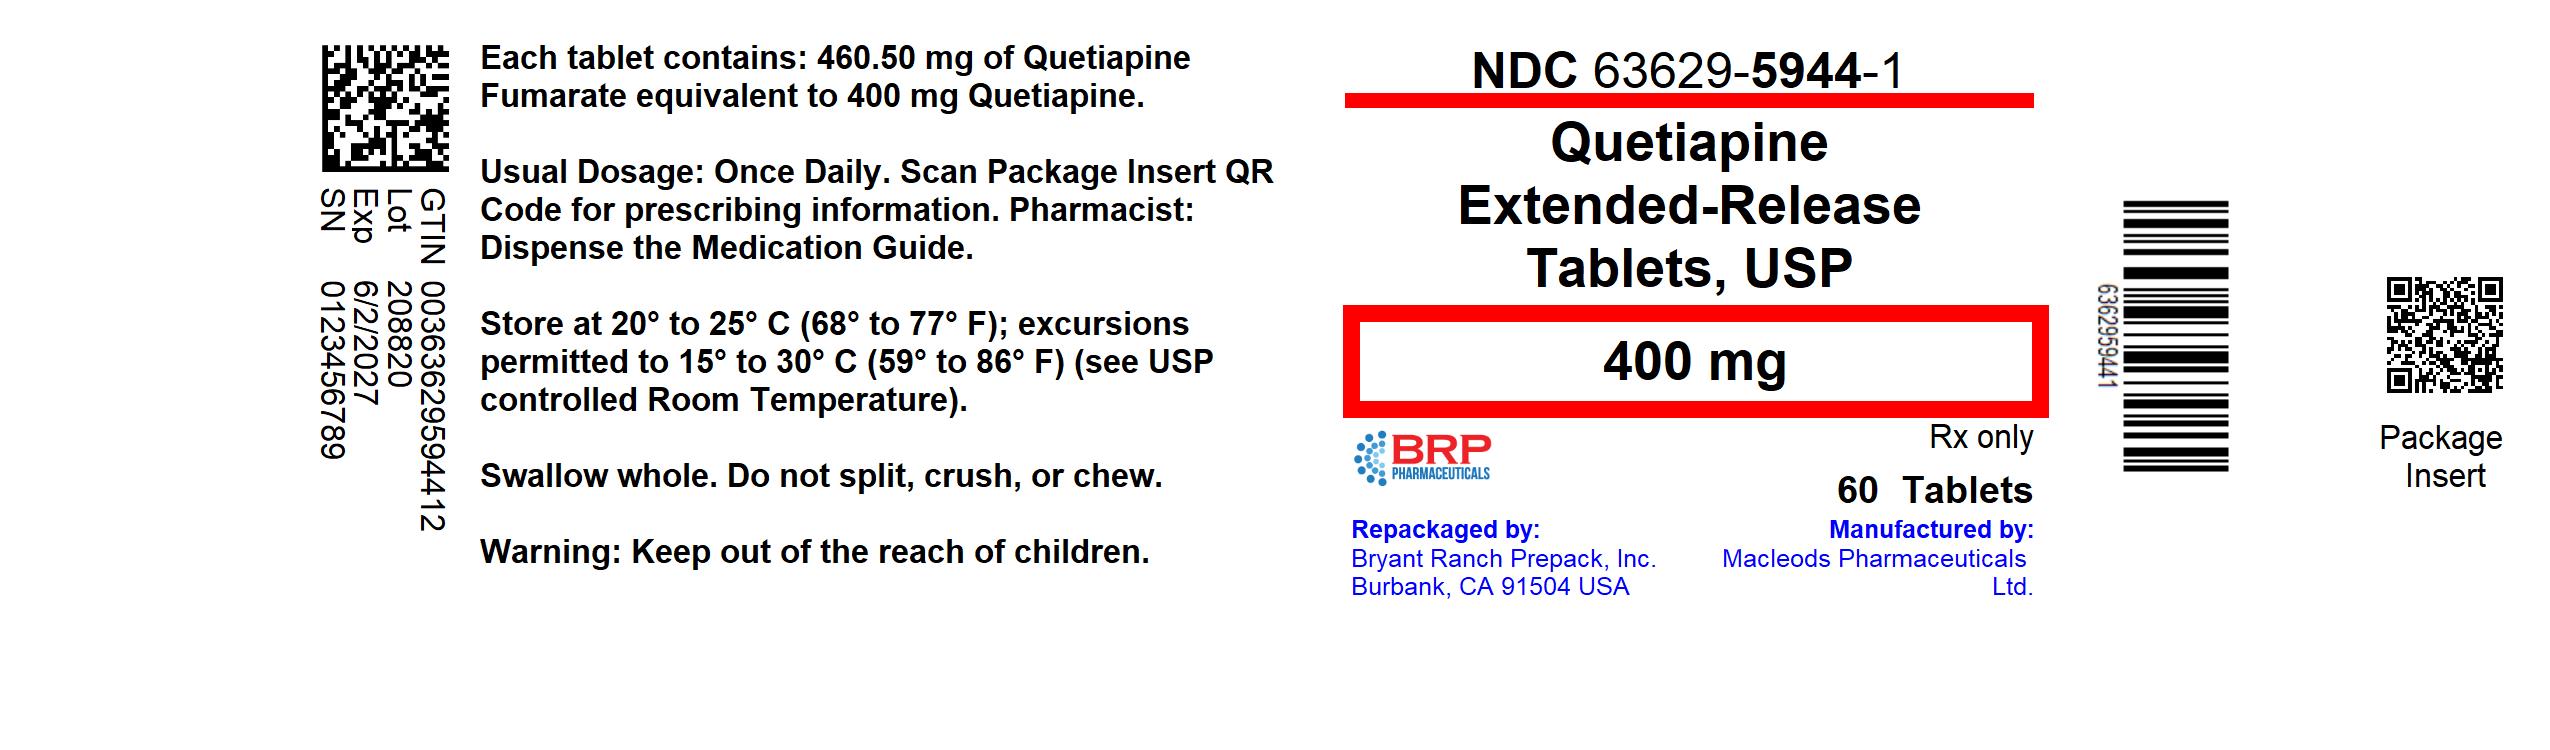
Label for Quetiapine Extended-Release Tablets USP 400 mg by Bryant Ranch Prepack. The label indicates a package of 60 tablets, with storage instructions between 20° to 25° C. The product is repackaged by Bryant Ranch Prepack, Inc. and manufactured by Macleods Pharmaceuticals Ltd. Contains QR codes and barcodes for scanning and tracking.*
FDA Label Image

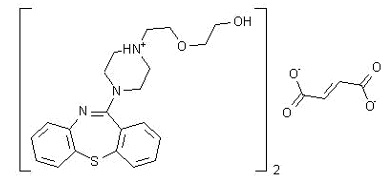
Quetiapine-fig-1 (Quetiapine Fig 1)

Quetiapine-fig-1 (Quetiapine Fig 1)
Chemical structure diagram of the active ingredient Quetiapine, illustrating its molecular composition, including two quetiapine cations paired with two anions, likely representing a salt form. The structure shows rings and functional groups characteristic of quetiapine.*
FDA Label Image

Quetiapine-fig-2 (Quetiapine Fig 2)

Quetiapine-fig-2 (Quetiapine Fig 2)
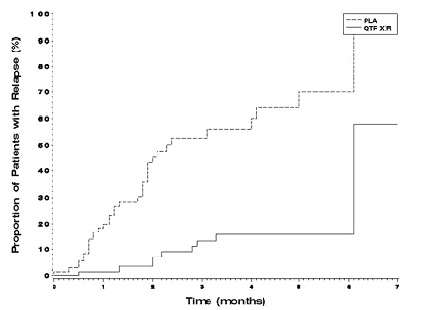
A line chart showing the proportion of patients with relapse over time (months). Two lines are displayed: one for PLA and one for QTF XR, comparing relapse rates in patient groups over a span of about 13 months. The y-axis represents the percentage of patients relapsing, and the x-axis represents time in months.*
FDA Label Image

Quetiapine-fig-3 (Quetiapine Fig 3)

Quetiapine-fig-3 (Quetiapine Fig 3)
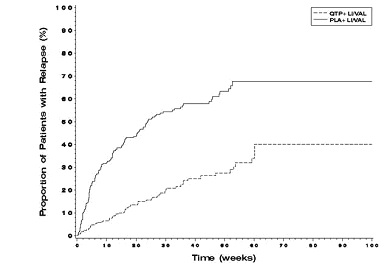
A Kaplan-Meier curve graph showing the proportion of patients with relapse (%) over time (weeks) for two groups labeled QTP+ LIVALO and PLA+ LIVALO. The y-axis represents the relapse percentage from 0 to 100%, and the x-axis shows time from 0 to 100 weeks. The graph compares relapse rates between the two groups.*
FDA Label Image

Quetiapine-fig-4 (Quetiapine Fig 4)

Quetiapine-fig-4 (Quetiapine Fig 4)
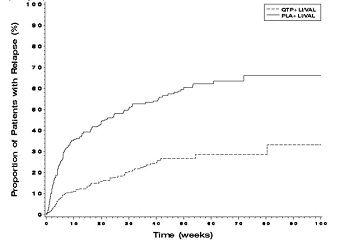
A line graph showing the proportion of patients with relapse (%) over time in weeks (0 to 16). Two curves are plotted, one solid and one dashed, comparing relapse rates between two treatment groups labeled as QTP + LIVAL and PLA + LIVAL.*

* About these descriptions: Image descriptions on this page are generated by automated AI analysis of the product label images from the manufacturer's FDA label submission (SPL). They are provided for reference only and may contain errors or omissions. Always rely on the printed label itself and the official FDA labeling, and consult a pharmacist or healthcare professional with any questions about this product.