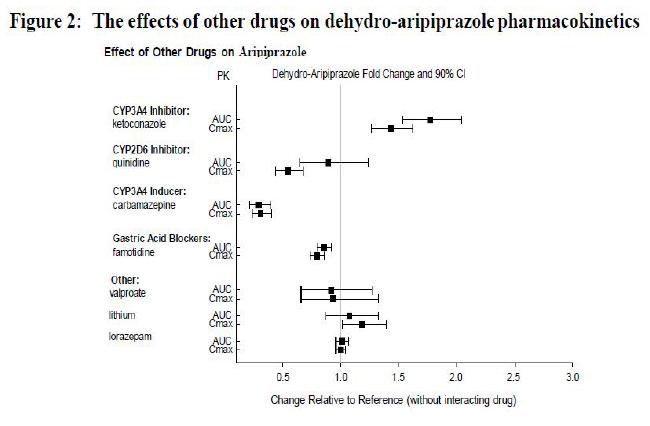
Product Images Aripiprazole

View Photos of Packaging, Labels & Appearance

Product Label Images

The following 13 images provide visual information about the product associated with Aripiprazole NDC 63629-7108 by Bryant Ranch Prepack, such as packaging, labeling, and the appearance of the drug itself. This resource could be helpful for medical professionals, pharmacists, and patients seeking to verify medication information and ensure they have the correct product.

Image 1 - image fig1 effectofotherdrug arip

Image 1 - image fig1 effectofotherdrug arip

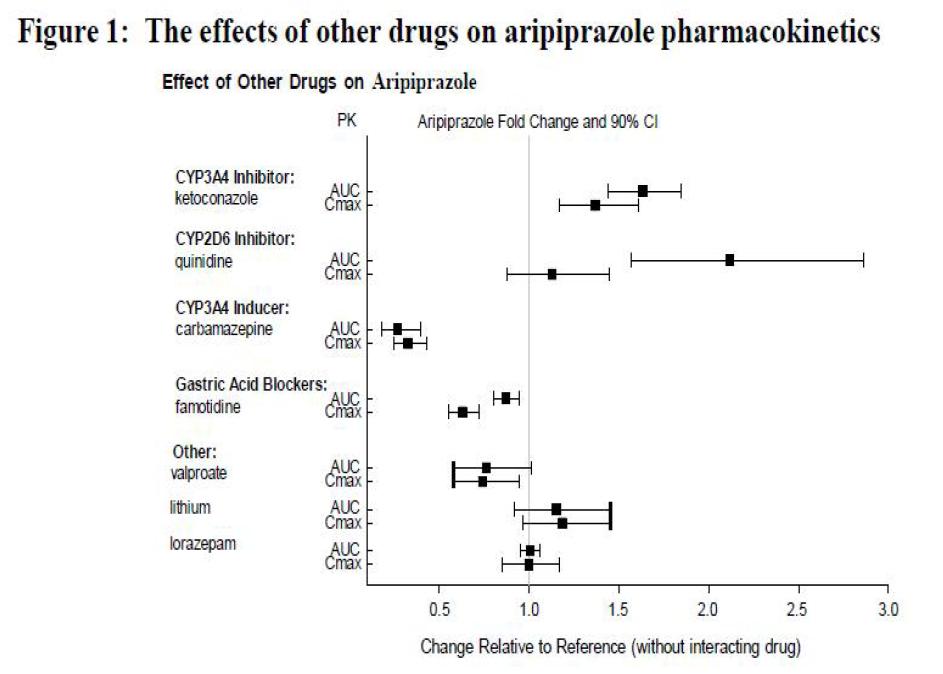
This is a table presenting the effects of various drugs on the pharmacokinetics of aripiprazole. The table lists drugs that either inhibit or induce certain enzymes, gastric acid blockers, or other drugs such as valproate, lithium, and lorazepam. Fold change and 90% confidence intervals of aripiprazole are shown relative to the reference (without interacting drug).*

Image 2 - image fig2 effectofotherdrug dehydroarip

Image 2 - image fig2 effectofotherdrug dehydroarip

image 3 - image fig3 effectofarip otherdrug

image 3 - image fig3 effectofarip otherdrug

This is a table depicting the effects of aripiprazole on the pharmacokinetics of various drugs. The table contains data on the changes seen in drug metabolism, expressed as fold change and 50% confidence interval. The drugs studied include deropmetoptan, cvpace, artann, Roartain S, omeprazole, UoTiAd, lamotigine, valproate, lithium, lorazepam, venidaine, Odesmyhenataing, and escitiopram. The relative change in pharmacokinetics is shown on the X-axis, ranging from 0 to 30.*

Image 4 - image fig4 effectofintrinsicfactor arip

Image 4 - image fig4 effectofintrinsicfactor arip

This appears to be a table or a figure related to pharmacokinetics of aripiprazole for different populations based on intrinsic factors such as age, gender, and hepatic or renal impairment. It shows the fold change and 90% confidence interval for different parameters such as AUC and Cmax in different populations as compared to a reference group. Without the actual values or units, it is not possible to provide specific information about the pharmacokinetics of aripiprazole.*

image 5 - image fig5 effectofintrinsicfactor dehydroarip

image 5 - image fig5 effectofintrinsicfactor dehydroarip

The text describes a figure showing the effects of intrinsic factors on the pharmacokinetics of dehydro-aripiprazole. The factors considered include CYP2D6 metabolizer status, age, gender, hepatic impairment, and renal impairment. The figure presents fold change and S0% CI for each factor on AUC and Cmax, with separate comparisons for different levels of each factor (e.g., poor vs. extensive CYP2D6 metabolizers). The figure also includes a line graph of the relative change in pharmacokinetics compared to a reference group.*

fig 6 - image fig6 schizophreniastudy 5

fig 6 - image fig6 schizophreniastudy 5

This is a graph depicting the proportion of patients with relapse in a schizophrenia study (Study 5) using Kaplan-Meier estimation. The graph compares the proportion of relapse between patients who received Aripiprazole and those who were given a placebo. The number of subjects at risk is shown below the graph for each treatment group. The x-axis is the number of days from randomization, and the y-axis represents the cumulative proportion of patients with relapse.*

7 - image fig7 bipolarstudy 7

7 - image fig7 bipolarstudy 7

8 - image fig8 bipolarstudy 8

8 - image fig8 bipolarstudy 8

The figure shows the Kaplan-Meier estimation of the cumulative proportion of patients who experienced a relapse to any mood event in Bipolar Study 8. The proportion of patients with relapse is plotted on the y-axis and the days from randomization are plotted on the x-axis. The two treatment groups compared are ABILIFY and LACE 169. There are some illegible characters in the text.*

9 - image fig9 tourettesdisorderstudy1

9 - image fig9 tourettesdisorderstudy1

This is a graphical representation of the least square means of change from baseline in YGTSS TTS for Tourette's Disorder Study 1. The graph depicts the change in YGTSS total tic score from baseline, and displays the data for 5 time points (weeks) of treatment. The values are presented in a tabular format, with the least square means of change in YGTSS score being presented for each week of treatment. The data may be useful for evaluating treatment efficacy in patients with Tourette's Disorder.*

Image - image logo medguide

Image - image logo medguide

logo - image logo pi

logo - image logo pi

description image - image structure

description image - image structure

Not available.*

Label - lbl636297108

Label - lbl636297108

This is information about a medication called Abilify 15mg Tablet, with its manufacturer and packaging details. It also includes a warning to keep all drugs out of the reach of children.*

* The product label images have been analyzed using a combination of traditional computing and machine learning techniques. It should be noted that the descriptions provided may not be entirely accurate as they are experimental in nature. Use the information in this page at your own discretion and risk.