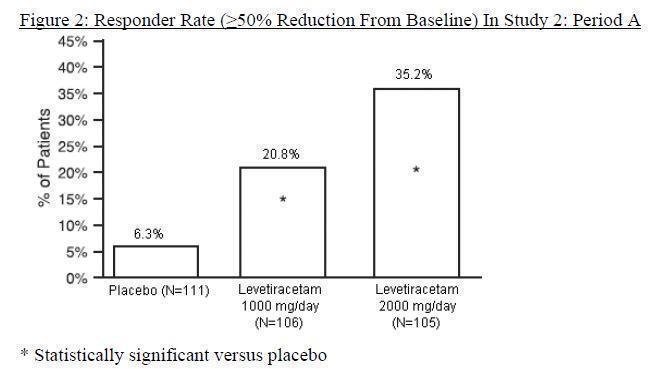
Figure 2: Responder Rate (≥50% Reduction From Baseline) In Study 2: Period A (F7b86151 8fdf 4bb8 8cd6 E6e24786df64 02)

The given text provides formulas for calculating two medical parameters: estimated creatinine clearance (CrCl) and serum creatinine. The first formula measures the CrCl, which is determined by taking 140 and subtracting the patient's age (in years) before multiplying the result by the patient's weight (in kilograms). For female patients, the final result should be multiplied by 0.85. The second formula calculates serum creatinine using a value of 72 and the patient's serum creatinine level (in mg/dL).*