Desvenlafaxine Tablet, Extended Release
Product Images NDC 63629-7559

View Photos of Packaging, Regulatory Labels, and Product Appearance

Product Visual Gallery

This gallery contains 7 technical images submitted to the FDA as part of the official labeling for Desvenlafaxine (NDC 63629-7559). Unlike standard consumer photos, these assets often include clinical data figures, molecular chemical structures, and official manufacturer packaging layouts.

As provided by Bryant Ranch Prepack, these visuals offer a comprehensive scientific overview of the product's physical and chemical identity, aiding pharmacists and researchers in product verification and study.

FDA Label Image

Figure 1 (Desvenlafaxine Figure1)
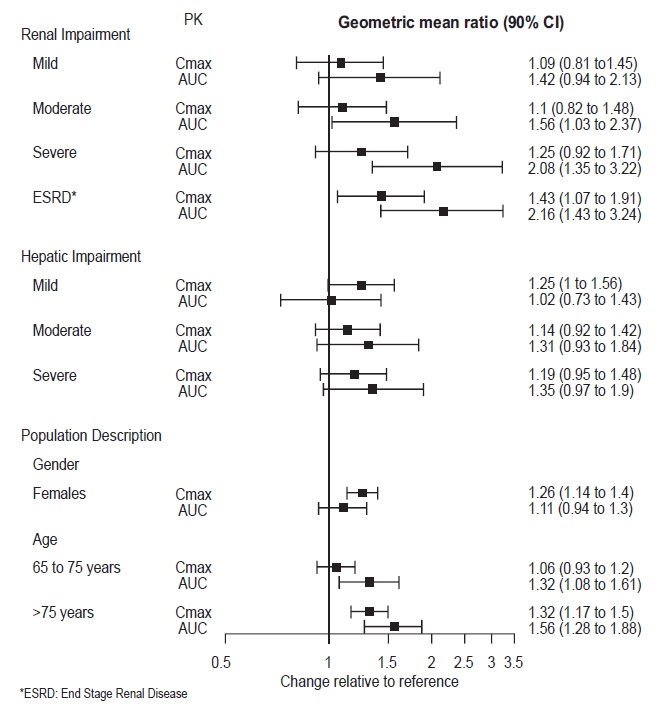
Figure 1 (Desvenlafaxine Figure1)
A pharmacokinetic (PK) figure showing geometric mean ratio (90% CI) of Cmax and AUC under conditions of renal and hepatic impairment, as well as population subgroups by gender and age. The graph compares PK changes relative to reference, with data points and confidence intervals for mild, moderate, and severe impairment, including End Stage Renal Disease (ESRD), females, and age groups 65-75 and over 75 years.*
FDA Label Image

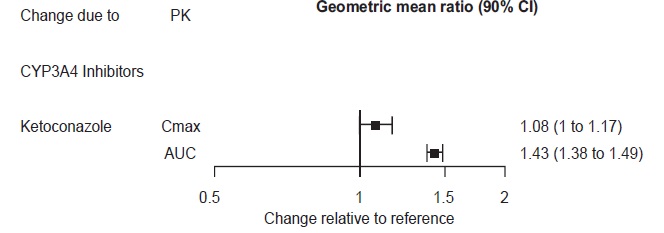
Figure 2 (Desvenlafaxine Figure2)

Figure 2 (Desvenlafaxine Figure2)
A chart depicting the geometric mean ratio with 90% confidence intervals for pharmacokinetics changes in desvenlafaxine when coadministered with the CYP3A4 inhibitor ketoconazole. It shows changes in Cmax and AUC relative to reference, with ratios approximately 1.08 and 1.43 respectively, on a horizontal axis ranging from 0.5 to 2.0.*
FDA Label Image

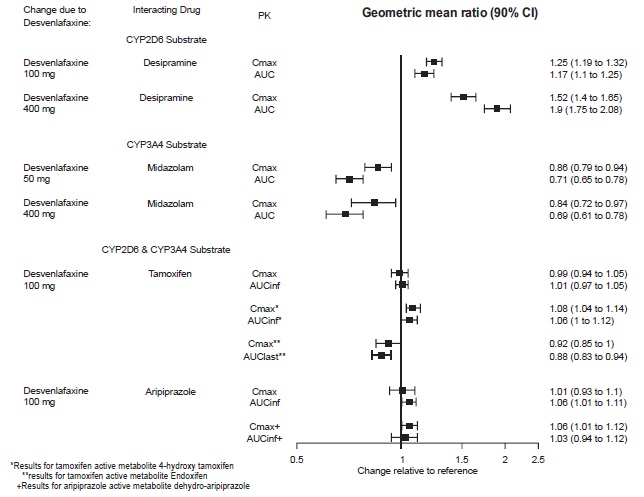
Figure 3 (Desvenlafaxine Figure3)

Figure 3 (Desvenlafaxine Figure3)
A forest plot chart depicting geometric mean ratios (90% confidence intervals) comparing pharmacokinetic parameters (Cmax and AUC) of various interacting drugs with Desvenlafaxine at different strengths (50 mg, 100 mg, 400 mg). The drugs include Desipramine, Midazolam, Tamoxifen, and Aripiprazole, showing changes relative to reference values on a horizontal axis ranging approximately from 0.5 to 2.5.*
FDA Label Image

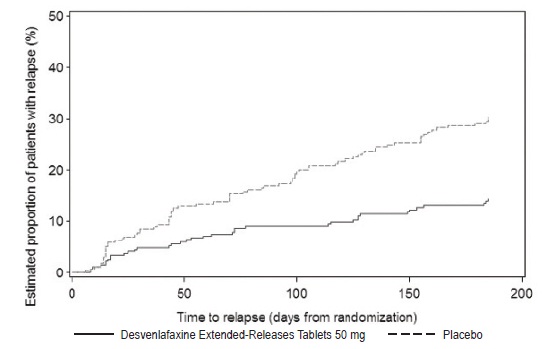
Figure 4 (Desvenlafaxine Image4)

Figure 4 (Desvenlafaxine Image4)
A Kaplan-Meier survival curve chart showing estimated proportion of patients with relapse (%) over time in days since randomization. It compares Desvenlafaxine Extended-Release Tablets 50 mg (solid line) with placebo (dashed line) over approximately 200 days.*
FDA Label Image

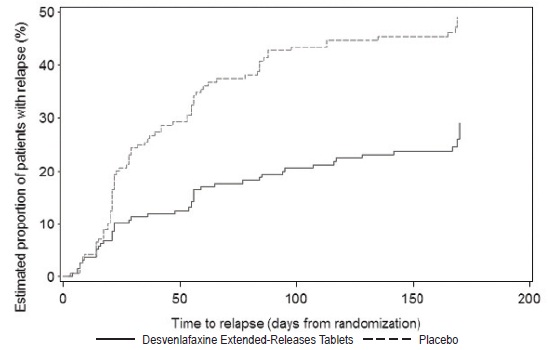
Figure 5 (Desvenlafaxine Image5)

Figure 5 (Desvenlafaxine Image5)
A Kaplan-Meier curve chart depicting the estimated proportion of patients with relapse (%) over time in days from randomization. Two lines compare Desvenlafaxine Extended-Release Tablets and placebo, showing relapse rates up to about 180 days. The Desvenlafaxine group demonstrates a lower relapse proportion compared to placebo throughout the time period.*
FDA Label Image

Structure (Desvenlafaxine Structure1)

Structure (Desvenlafaxine Structure1)
Chemical structure diagram of desvenlafaxine, showing its molecular components including hydroxyl groups and carboxyl groups, as well as its hydrate form. The image details the arrangement of atoms and bonds in the active ingredient desvenlafaxine.*
FDA Label Image

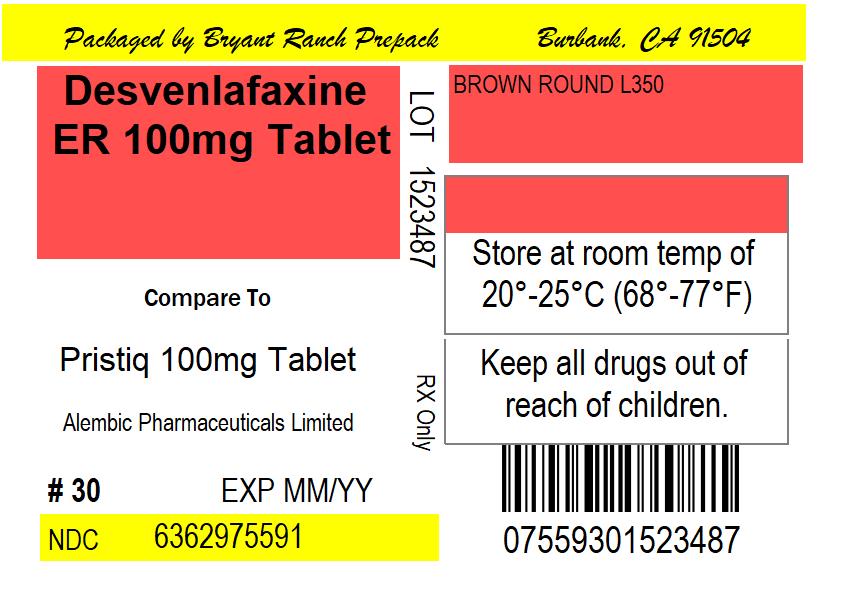
Label (Lbl636297559)

Label (Lbl636297559)
Desvenlafaxine ER 100 mg tablet label packed by Bryant Ranch Prepack, Burbank, CA. It includes a comparison to Pristiq 100 mg tablet by Alembic Pharmaceuticals Limited. The label shows storage instructions at 20°-25°C, a lot number 1523487, and states the product is Rx only. Package contains 30 tablets with NDC 63629-7559.*

* About these descriptions: Image descriptions on this page are generated by automated AI analysis of the product label images from the manufacturer's FDA label submission (SPL). They are provided for reference only and may contain errors or omissions. Always rely on the printed label itself and the official FDA labeling, and consult a pharmacist or healthcare professional with any questions about this product.