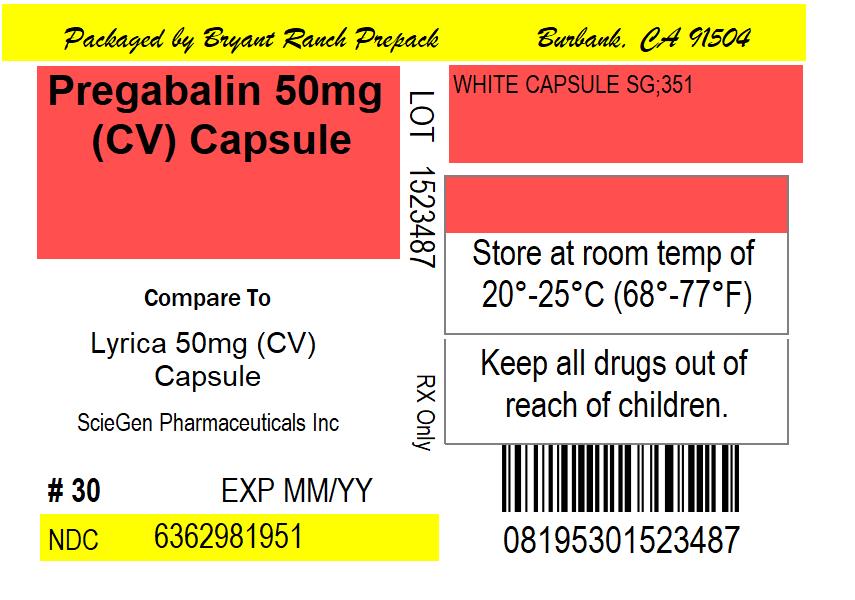
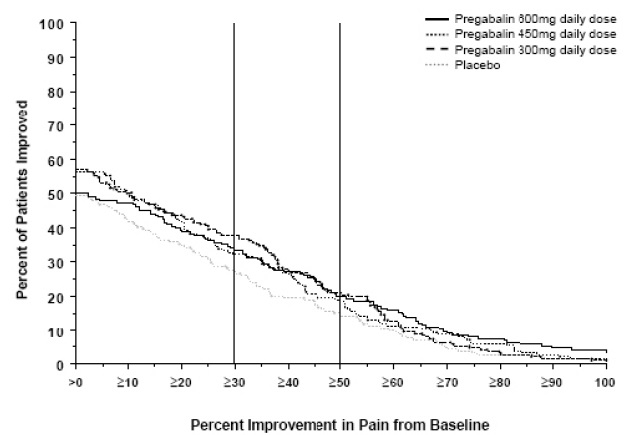
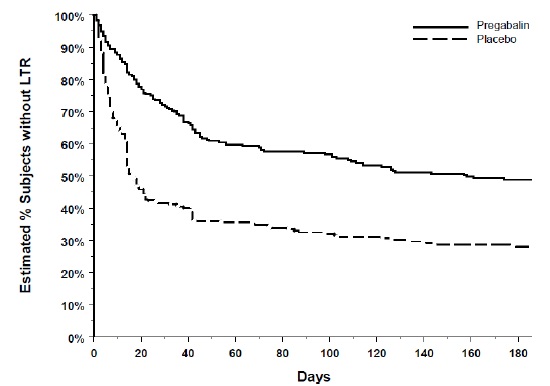
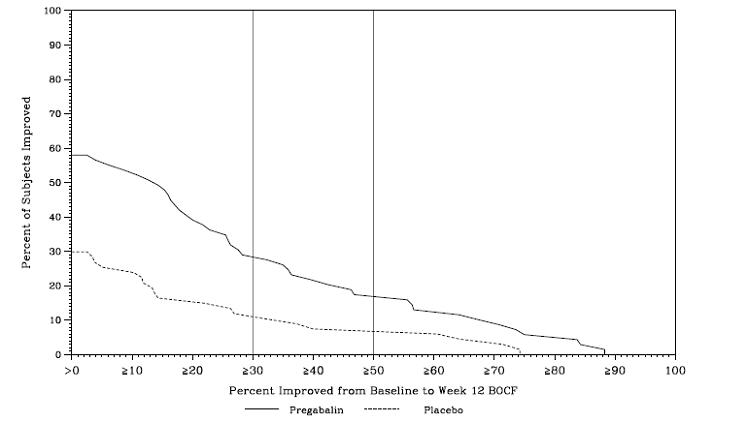
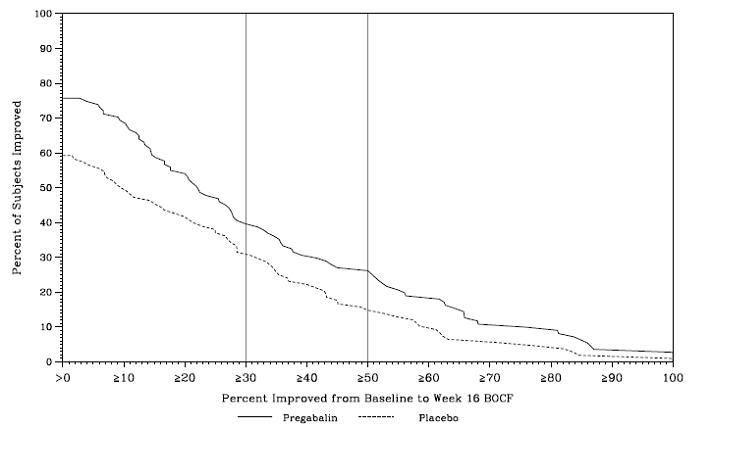
Label Image (Lbl636298195)
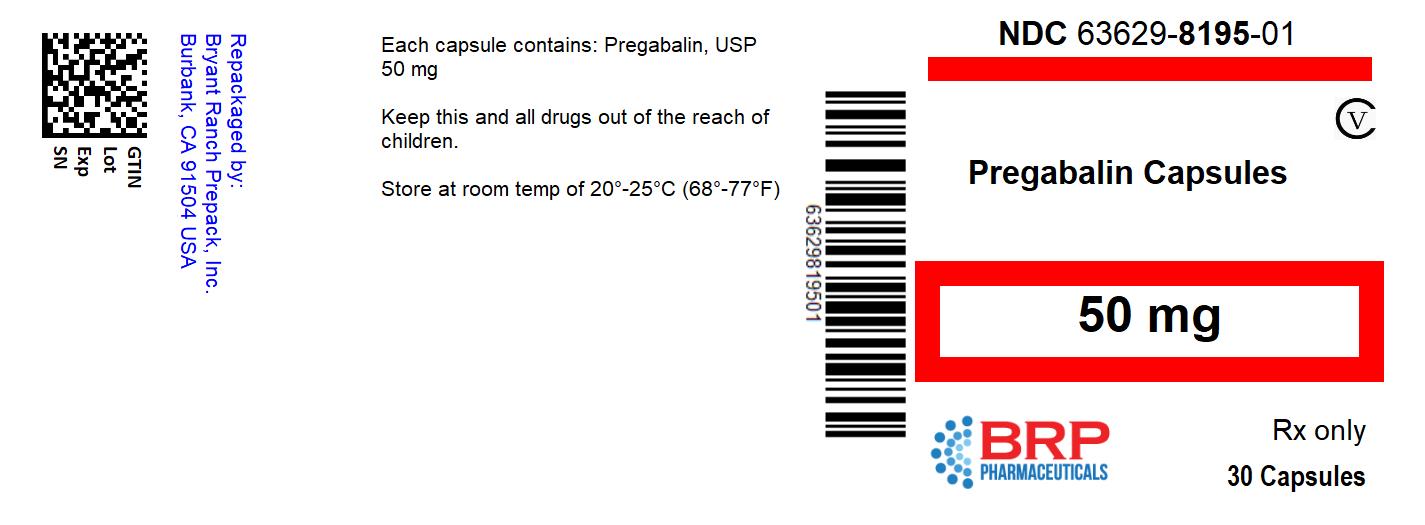
This is a description for Pregabalin Capsules. The capsules contain 50 mg of Pregabalin, USP, which is a medication used for pain relief. The instructions indicate to keep the medication out of the reach of children and store at room temperature. The NDC code for this medication is 63629-8195-01, and it comes in a bottle of 30 capsules.*