Pregabalin Capsule
Product Images NDC 63629-8197

View Photos of Packaging, Regulatory Labels, and Product Appearance

Product Visual Gallery

This gallery contains 15 technical images submitted to the FDA as part of the official labeling for Pregabalin (NDC 63629-8197). Unlike standard consumer photos, these assets often include clinical data figures, molecular chemical structures, and official manufacturer packaging layouts.

As provided by Bryant Ranch Prepack, these visuals offer a comprehensive scientific overview of the product's physical and chemical identity, aiding pharmacists and researchers in product verification and study.

FDA Label Image

Label (Lbl636298197)

Label (Lbl636298197)
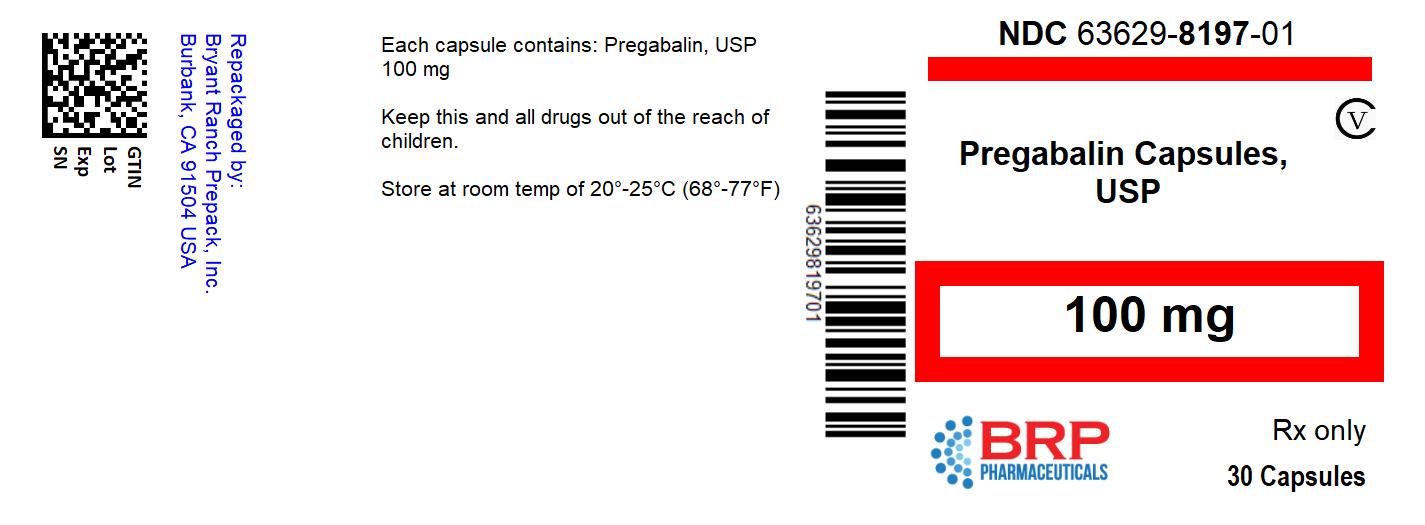
This is a description of a medication called Pregabalin Capsules, USP. Each capsule contains 100mg of Pregabalin, USP. The medication should be kept out of reach from children and stored at room temperature of 20°-25°C (68°-77°F). The information also includes the National Drug Code (NDC) which is 63629-8197-01 and the manufacturer's name: H BRP Pharmaceuticals.*
FDA Label Image

Label (Lbl6362981972)

Label (Lbl6362981972)
This is a medication package for a generic version of Lyrica 100mg, manufactured by ScieGen Pharmaceuticals Inc. The package was labeled and prepackaged by Bryant Ranck Prepack and contains 30 capsules. The NDC number is 6362981971, and the package should be stored at room temperature. The text also includes a warning to keep all drugs out of reach of children.*
FDA Label Image

Figure 1 (Pregabalin Fig01)

Figure 1 (Pregabalin Fig01)
The data provided is not clear and appears to have errors. Therefore, the description cannot be generated.*
FDA Label Image

Figure 2 (Pregabalin Fig02)

FDA Label Image

Figure 3 (Pregabalin Fig03)

Figure 3 (Pregabalin Fig03)
This text appears to be a chart or data table displaying information on different medications and their effectiveness in improving patient conditions. It includes various dosages and frequencies for Pregabalin and Pregabain, and a graph showing the percentage of improvement in pain from a baseline. Without additional context or clearer formatting, it is difficult to provide a more specific description.*
FDA Label Image

Figure 4 (Pregabalin Fig04)

FDA Label Image

Figure 5 (Pregabalin Fig05)

Figure 5 (Pregabalin Fig05)
This appears to be a table showing the dosages of Fregabalin, Pregataiin, and Placebo administered three times a day and the percentage of patients who improved. It also shows the percentage improvement in pain from baseline. However, the text is not formatted correctly and there are errors making it difficult to fully understand the information presented.*
FDA Label Image

Figure 6 (Pregabalin Fig06)

Figure 6 (Pregabalin Fig06)
This is a chart/table format that displays the results of some studies. It shows several groups receiving different dosages of a medication and a placebo, with some indication of their effectiveness compared to the placebo. Not much other context or information is given.*
FDA Label Image

Figure 7 (Pregabalin Fig07)

FDA Label Image

Figure 9 (Pregabalin Fig08)

Figure 9 (Pregabalin Fig08)
The text presents a chart depicting the percentage of patients who improved when taking different doses of Pregabalin and placebo. The x-axis shows the percentage improvement in pain from baseline and the y-axis shows the dosage of Pregabalin and placebo. There is no additional information available in the text.*
FDA Label Image

Figure 10 (Pregabalin Fig09)

Figure 10 (Pregabalin Fig09)
This seems to be a graph with estimated percentage of subjects without LTR for a treatment named "Progabain" and a placebo, over a period of 120 to 180 days. There are different percentages ranging from 0% to 100% for each treatment. It is not possible to gather further information from this text.*
FDA Label Image

Figure 11 (Pregabalin Fig10)

FDA Label Image

Figure 12 (Pregabalin Fig11)

Figure 12 (Pregabalin Fig11)
This table shows the percentage of subjects who improved after taking pregabalin and placebo for 16 weeks. The numbers on the left represent the percentages of improvement, with 100 being the minimum and 280 the maximum. The numbers on the top represent the doses of the drugs in mg.*
FDA Label Image

Cockcroft And Gault Equation (Pregabalin Formula)

Cockcroft And Gault Equation (Pregabalin Formula)
This appears to be a formula for calculating a patient's estimated creatinine clearance (CLCT), which is important for assessing kidney function. The formula involves subtracting the patient's age (in years) from 140, multiplying that result by the patient's weight in kilograms, then multiplying the result by 0.85 for female patients. The final step is to multiply the product of those steps by the patient's serum creatinine level measured in milligrams per deciliter (mg/dL) and divide by 72.*
FDA Label Image

Chemical Structure (Pregabalin Str)

* These product label images have been analyzed using experimental machine learning. Please verify findings with the primary label text.