Dutasteride Capsule, Liquid Filled
Product Images NDC 63629-8207

11 FDA label images from Bryant Ranch Prepack · Packaging, Regulatory Labels, and Product Appearance

Product Visual Gallery

This gallery contains 11 technical images submitted to the FDA as part of the official labeling for Dutasteride (NDC 63629-8207). Unlike standard consumer photos, these assets often include clinical data figures, molecular chemical structures, and official manufacturer packaging layouts.

As provided by Bryant Ranch Prepack, these visuals offer a comprehensive scientific overview of the product's physical and chemical identity, aiding pharmacists and researchers in product verification and study.

FDA Label Image

Fig1 (Fig1)

Fig1 (Fig1)
A line graph showing the mean change from baseline in AUA-SI score over 24 months of treatment in a randomized, double-blind, placebo-controlled trial. The two lines represent placebo and Dutasteride groups, with data points at 0, 1, 3, 6, 12, 18, and 24 months. The Dutasteride group shows a greater decrease in score compared to placebo. Sample sizes for each group at different time points are indicated below the x-axis.*
FDA Label Image

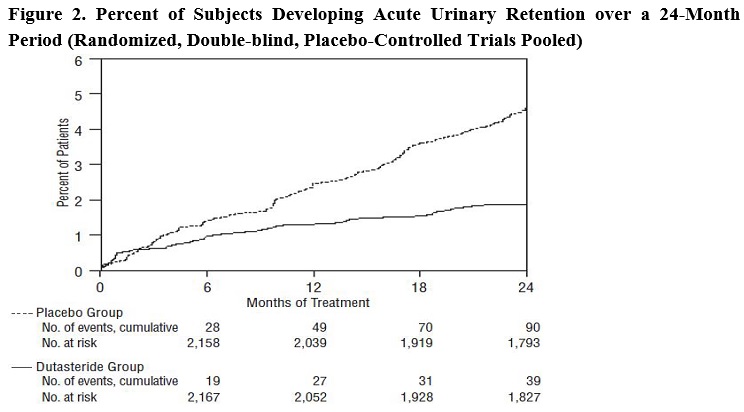
Fig2 (Fig2)

Fig2 (Fig2)
A line graph titled 'Percent of Subjects Developing Acute Urinary Retention over a 24-Month Period' comparing placebo and dutasteride groups in randomized, double-blind, placebo-controlled trials. The x-axis shows months of treatment (0 to 24), and the y-axis shows percent of patients (0 to 6%). Two lines represent cumulative events: placebo group with higher percent, dutasteride group lower. Below the graph are cumulative event counts and numbers at risk at several time points for each group.*
FDA Label Image

Fig3 (Fig3)

Fig3 (Fig3)
A line graph showing the percent of patients having surgery for benign prostatic hyperplasia over 24 months, comparing a placebo group and a Dutasteride group. The x-axis represents months of treatment (0 to 24), and the y-axis shows percent of patients (0 to 6%). Cumulative events and numbers at risk for both groups are listed at 0, 6, 12, 18, and 24 months. The Dutasteride group shows a lower surgery rate than the placebo group over time.*
FDA Label Image

Fig4 (Fig4)

Fig4 (Fig4)
A bar chart depicting prostate volume percent change from baseline over 0, 1, 3, 6, 12, and 24 months of treatment in randomized, double-blind, placebo-controlled pooled trials. It compares mean percent change between placebo and Dutasteride groups, showing greater volume reduction in the Dutasteride group at each time point.*
FDA Label Image

Fig5 (Fig5)

Fig5 (Fig5)
A line graph titled 'Qmax Change from Baseline (Randomized, Double-blind, Placebo-Controlled Trials Pooled)' comparing mean change from baseline (mL/sec) over 24 months of treatment between Dutasteride and placebo groups. The x-axis represents months of treatment, and the y-axis shows mean change. Dutasteride shows increasing improvement over time, while placebo remains relatively flat.*
FDA Label Image

Fig6 (Fig6)

Fig6 (Fig6)
A line graph depicting the International Prostate Symptom Score (IPSS) change from baseline over a 48-month treatment period. The graph compares three groups: Dutasteride plus tamsulosin, Dutasteride 0.5 mg, and Tamsulosin 0.4 mg, showing mean IPSS change on the vertical axis and months of treatment on the horizontal axis. Sample sizes are approximately 1,575 for each group throughout the study.*
FDA Label Image

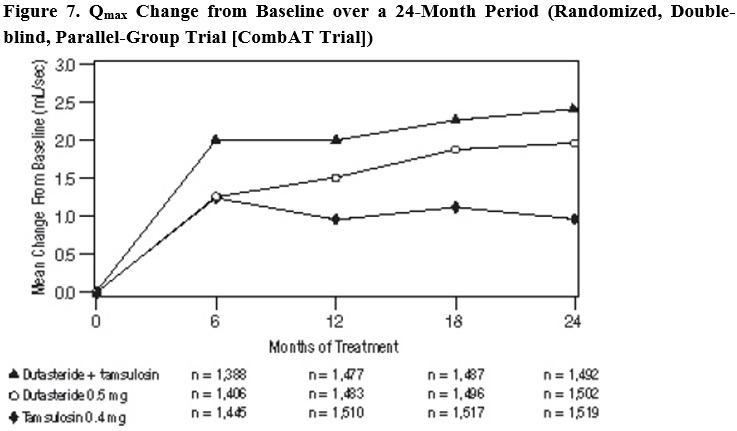
Fig7 (Fig7)

Fig7 (Fig7)
A line graph titled 'Qmax Change from Baseline over a 24-Month Period' from a randomized, double-blind, parallel-group trial (CombAT Trial). The graph shows mean change in Qmax (mL/sec) from baseline on the y-axis over months of treatment (0, 6, 12, 18, 24) on the x-axis. Three treatment groups are presented: Dutasteride + tamsulosin, Dutasteride 0.5 mg, and Tamsulosin 0.4 mg, with associated sample sizes at each time point. The Dutasteride + tamsulosin group shows the highest increase in Qmax over time compared to the other groups.*
FDA Label Image

Structure (Structure)

Structure (Structure)
Chemical structure of Dutasteride, showing its steroidal backbone with trifluoromethyl-substituted phenyl groups and characteristic amide functional groups.*
FDA Label Image

Tab1 (Tab1)

Tab1 (Tab1)
A data table showing adverse reactions reported in at least 1% of subjects over 24 months, comparing Dutasteride and placebo groups. The table includes incidence rates for impotence, decreased libido, ejaculation disorders, and breast disorders across four time periods (0-6, 7-12, 13-18, 19-24 months). Footnotes explain the nature of sexual adverse reactions and breast disorders.*
FDA Label Image

Tab2 (Tab2)

Tab2 (Tab2)
Table showing adverse reactions reported over a 48-month period in subjects receiving Dutasteride, Tamsulosin, and their combination therapy. The table lists time of onset for reactions such as ejaculation disorders, impotence, decreased libido, breast disorders, and dizziness, with percentages for each treatment group across months 0-6, 7-12, and years 2 to 4.*
FDA Label Image

Label Image (Lbl636298207)

Label Image (Lbl636298207)
Label for Dutasteride 0.5 mg liquid-filled capsule by Bryant Ranch Prepack. The label includes comparison to Avodart 0.5 mg capsule by Ascent Pharmaceuticals, with a package count of 30 capsules. Storage instructions recommend room temperature between 20-25°C (68-77°F), and a barcode is present along with warnings to keep drugs out of children's reach.*

* About these descriptions: Image descriptions on this page are generated by automated AI analysis of the product label images from the manufacturer's FDA label submission (SPL). They are provided for reference only and may contain errors or omissions. Always rely on the printed label itself and the official FDA labeling, and consult a pharmacist or healthcare professional with any questions about this product.