Pregabalin Capsule
Product Images NDC 63629-8248

View Photos of Packaging, Regulatory Labels, and Product Appearance

Product Visual Gallery

This gallery contains 15 technical images submitted to the FDA as part of the official labeling for Pregabalin (NDC 63629-8248). Unlike standard consumer photos, these assets often include clinical data figures, molecular chemical structures, and official manufacturer packaging layouts.

As provided by Bryant Ranch Prepack, these visuals offer a comprehensive scientific overview of the product's physical and chemical identity, aiding pharmacists and researchers in product verification and study.

FDA Label Image

Label (Lbl636298248)

Label (Lbl636298248)
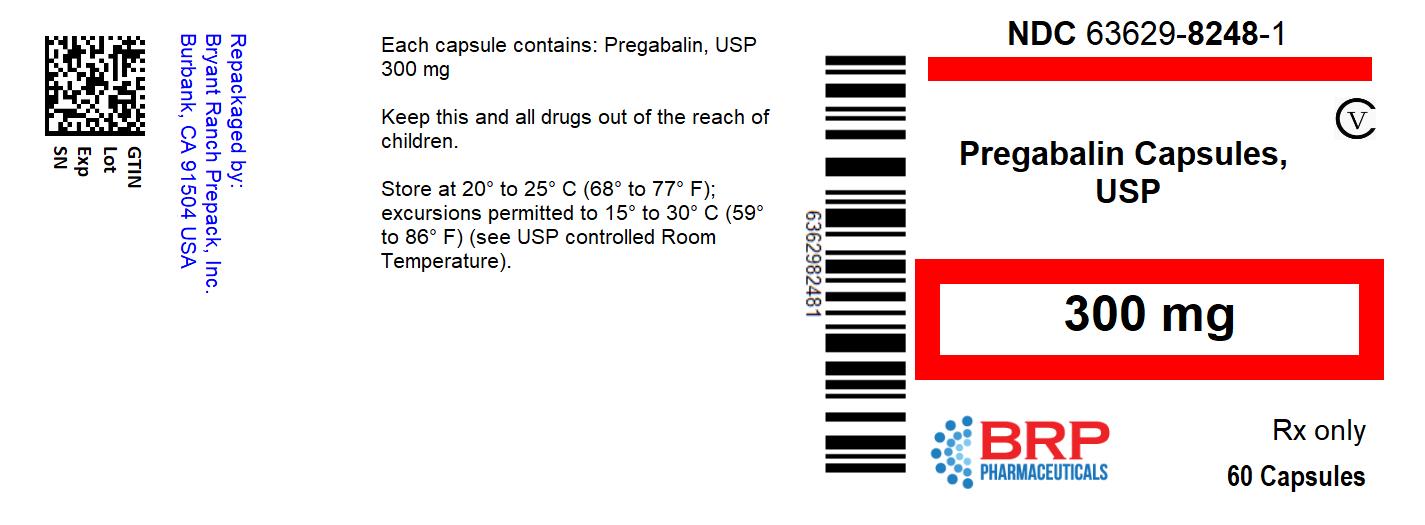
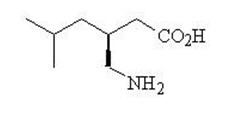
This is a description of a drug called NILD. The drug contains 300mg of Pregabalin, USP per capsule. It is recommended to be stored at a controlled room temperature within a specific range. The NDC number indicated is 63629-8248-1 and Rx only. Each package of NILD contains 60 capsules.*
FDA Label Image

Label (Lbl6362982482)

Label (Lbl6362982482)
This appears to be a package label for a medication labeled as "Compare To" Lyrica 300mg (CV) capsules from ScieGen Pharmaceuticals Inc. The package was prepacked by Bryant Ranck and contains 60 capsules with an expiration date of MM/YY. The NDC number is 6362982481 and the product should be stored at room temperature (20°-25°C or 68°-77°F). The label also includes a warning to keep all drugs out of the reach of children.*
FDA Label Image

Figure 1 (Pregabalin Fig01)

FDA Label Image

Figure 2 (Pregabalin Fig02)

Figure 2 (Pregabalin Fig02)
This appears to be a partial data table with some figures for percent improvement in pain from baseline and dosage information for Pregabalin, a medication used to treat nerve pain. However, some of the characters are distorted or missing, so the table is difficult to interpret fully.*
FDA Label Image

Figure 3 (Pregabalin Fig03)

Figure 3 (Pregabalin Fig03)
This appears to be a chart with information related to the percent of patient improvement in pain from baseline for different medications, including Pregatalin 300, Pregabain 160, and Pregabalin 75. It also includes numbers in a grid format, but it's unclear what these numbers represent.*
FDA Label Image

Figure 4 (Pregabalin Fig04)

FDA Label Image

Figure 5 (Pregabalin Fig05)

Figure 5 (Pregabalin Fig05)
This appears to be a table displaying different dosages of two medications, Pregabalin and Placebo, along with the percentage improvement in pain reported by patients from baseline. The dosage of Pregabalin is 80mg taken three times a day, while the dosage of the other medication Fregabalin is not clear due to a possible error. The table indicates that a higher percentage of patients experienced improvement in pain after taking Pregabalin compared to Placebo.*
FDA Label Image

Figure 6 (Pregabalin Fig06)

Figure 6 (Pregabalin Fig06)
This appears to be a table with various doses of medication labeled as "Placebo", "50mg/day", "150mg/day", "300mg/day", and "600mg/day." There are also reference to "Study E1" and "Study E3." However, without additional context or information, it is not possible to provide a more detailed description of the text.*
FDA Label Image

Figure 7 (Pregabalin Fig07)

FDA Label Image

Figure 9 (Pregabalin Fig08)

Figure 9 (Pregabalin Fig08)
The provided text is a graph that shows the percent improvement in pain from baseline for patients taking Pregabalin at 300mg and 450mg doses and for patients taking Placebo. There is no additional information available in the given text.*
FDA Label Image

Figure 10 (Pregabalin Fig09)

Figure 10 (Pregabalin Fig09)
This text seems to be a chart or a table, showing estimated percentages of subjects without LTR (possibly some medical condition) over a range of days. There are two groups listed: Progabain and Placebo, and each group likely represents a treatment group or a type of medication. Unfortunately, without further context, it is not clear what LTR refers to or what the percentages represent.*
FDA Label Image

Figure 11 (Pregabalin Fig10)

Figure 11 (Pregabalin Fig10)
This is a table showing the percent of subjects who improved in a clinical trial from baseline to week 12 using two different medications: Pregetalin and Placeso. The data is presented in four columns with the first column showing the increments of 10 from 210 to 240. The second and third columns show the percent of subjects who improved with Pregetalin and Placeso respectively.*
FDA Label Image

Figure 12 (Pregabalin Fig11)

Figure 12 (Pregabalin Fig11)
The text provides data on the percentage of subjects improved from baseline to week 16 using pregabalin and placebo. The values range from 100 to 280 and are presented in increments of 10. Therefore, it appears to be a graph or chart.*
FDA Label Image

Cockcroft And Gault Equation (Pregabalin Formula)

Cockcroft And Gault Equation (Pregabalin Formula)
This is a formula for estimating the creatinine clearance rate (CLCT) of a patient's kidneys. The formula uses the patient's age and weight, as well as their serum creatinine level. For female patients, the result is multiplied by 0.85. The accuracy of this formula may vary based on individual factors and should not be used as the sole determinant of kidney function.*
FDA Label Image

Chemical Structure (Pregabalin Str)

* These product label images have been analyzed using experimental machine learning. Please verify findings with the primary label text.