Levetiracetam Tablet, Film Coated
Product Images NDC 63629-8315

View Photos of Packaging, Regulatory Labels, and Product Appearance

Product Visual Gallery

This gallery contains 9 technical images submitted to the FDA as part of the official labeling for Levetiracetam (NDC 63629-8315). Unlike standard consumer photos, these assets often include clinical data figures, molecular chemical structures, and official manufacturer packaging layouts.

As provided by Bryant Ranch Prepack, these visuals offer a comprehensive scientific overview of the product's physical and chemical identity, aiding pharmacists and researchers in product verification and study.

FDA Label Image

Label Image (Lbl636298315)
Label Image (Lbl636298315)
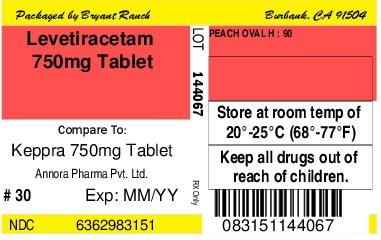
Levetiracetam 750 mg film-coated tablet label by Bryant Ranch Prepack. The label includes storage instructions (20°-25°C), a warning to keep out of reach of children, and references Keppra 750 mg tablets by Annora Pharma Pvt. Ltd. It displays NDC 63629-8315 and package quantity of 30 tablets.*
FDA Label Image

Levecamberlogo1 (Levecamberlogo1)

FDA Label Image

Levefig1 (Levefig1)

Levefig1 (Levefig1)
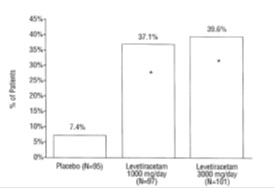
Bar chart comparing the percentage of patients across three groups: Placebo, Levetiracetam 1000 mg/day, and Levetiracetam 3000 mg/day. The chart shows percentages on the vertical axis and treatment groups on the horizontal axis.*
FDA Label Image

Levefig2 (Levefig2)

Levefig2 (Levefig2)
Bar chart comparing the percentage of patients across three groups: Placebo (N=111) at 6.3%, Levetiracetam 1000 mg/day (N=106) at 20.8%, and Levetiracetam 2000 mg/day (N=105) at 35.2%. The vertical axis represents the percentage of patients, ranging from 0% to 45%.*
FDA Label Image

Levefig3 (Levefig3)

Levefig3 (Levefig3)
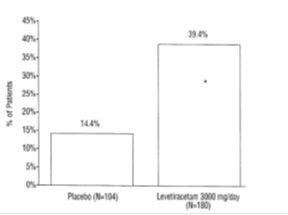
A bar chart comparing the percentage of patients between two groups: those receiving placebo and those receiving Levetiracetam 3000 mg/day. The placebo group shows 14.4%, while the Levetiracetam group shows 39.4%, with corresponding sample sizes indicated below each bar.*
FDA Label Image

Levefig4 (Levefig4)

Levefig4 (Levefig4)
A bar graph comparing the percentage of patients for Placebo (19.6%) and Levetiracetam (44.6%), with sample sizes of 87 and 101 patients respectively. The y-axis represents percentage of patients up to 45%.*
FDA Label Image

Levefig5 (Levefig5)

Levefig5 (Levefig5)
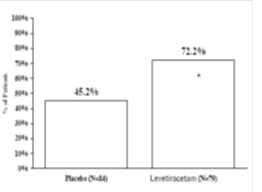
A bar graph comparing the percentage response rates between placebo and Levetiracetam 750 mg tablets. The vertical axis represents the percent response, with placebo showing approximately 45.2% and Levetiracetam at about 72.2%, indicating a higher response with Levetiracetam in the study groups shown.*
FDA Label Image

Levefig6 (Levefig6)

Levefig6 (Levefig6)
A bar chart comparing the percentage of a certain response in two groups: Placebo (N=68) with 45.2% and Levetiracetam (N=79) with 72.2%. The y-axis represents percent responders from 0% to 100%.*
FDA Label Image

Levestructure (Levestructure)

* About these descriptions: Image descriptions on this page are generated by automated AI analysis of the product label images from the manufacturer's FDA label submission (SPL). They are provided for reference only and may contain errors or omissions. Always rely on the printed label itself and the official FDA labeling, and consult a pharmacist or healthcare professional with any questions about this product.