Tramadol Hydrochloride Tablet, Extended Release
Product Images NDC 63629-8324

6 FDA label images from Bryant Ranch Prepack · Packaging, Regulatory Labels, and Product Appearance

Product Visual Gallery

This gallery contains 6 technical images submitted to the FDA as part of the official labeling for Tramadol Hydrochloride (NDC 63629-8324). Unlike standard consumer photos, these assets often include clinical data figures, molecular chemical structures, and official manufacturer packaging layouts.

As provided by Bryant Ranch Prepack, these visuals offer a comprehensive scientific overview of the product's physical and chemical identity, aiding pharmacists and researchers in product verification and study.

FDA Label Image

Label Image (Lbl636298324)
Label Image (Lbl636298324)
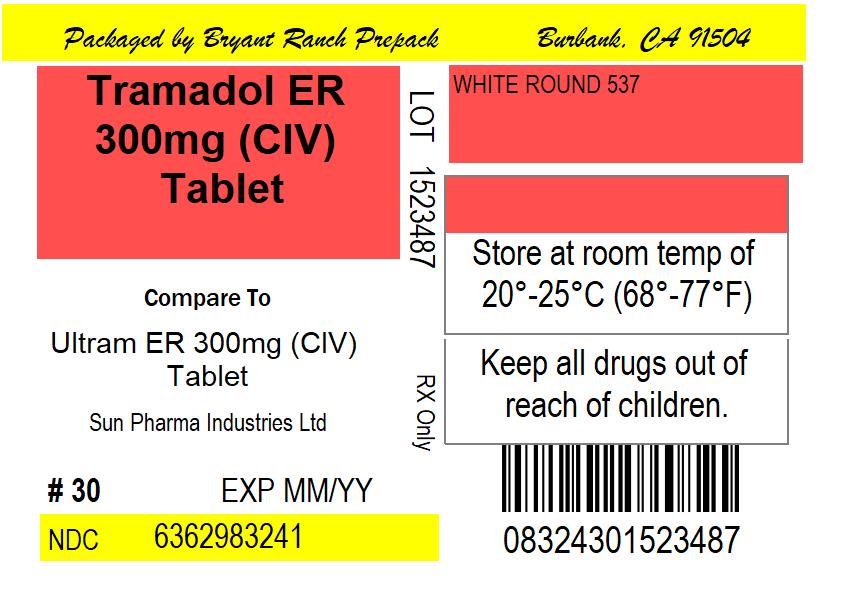
Label for Tramadol ER 300 mg (CIV) extended-release tablet, packaged by Bryant Ranch Prepack in Burbank, CA. The label references comparison to Ultram ER 300 mg (CIV) tablet by Sun Pharma Industries Ltd. It includes storage instructions at 20°-25°C (68°-77°F), a caution to keep drugs out of reach of children, a lot number, an expiration placeholder, and NDC 63629-8324.*
FDA Label Image

Tramadol-figure1 (Tramadol Figure1)

Tramadol-figure1 (Tramadol Figure1)
A line graph comparing the plasma concentration of Tramadol over 24 hours for two formulations: Tramadol Hydrochloride Extended-Release Tablets 200 mg once daily and Tramadol Immediate-Release (IR) Tablets 50 mg every 6 hours. The graph shows Tramadol concentration (ng/mL) on the y-axis and time in hours on the x-axis, illustrating different concentration-time profiles for the two dosing regimens.*
FDA Label Image

Tramadol-figure2 (Tramadol Figure2)

Tramadol-figure2 (Tramadol Figure2)
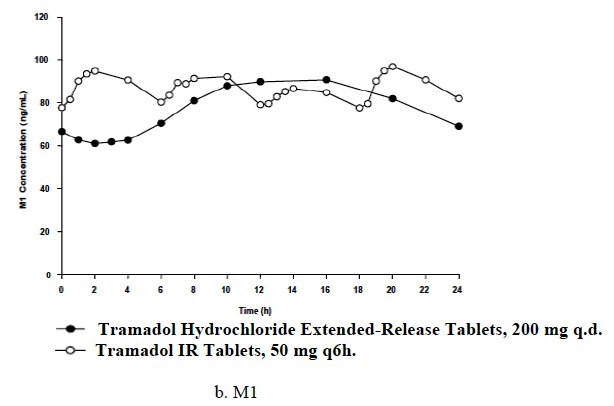
A graph comparing M1 concentration (ng/mL) over 24 hours for Tramadol Hydrochloride Extended-Release Tablets 200 mg once daily and Tramadol Immediate Release (IR) Tablets 50 mg every 6 hours. The x-axis represents time in hours, and the y-axis represents M1 concentration. Data points for each formulation are shown with different markers.*
FDA Label Image

Tramadol-figure3 (Tramadol Figure3)

Tramadol-figure3 (Tramadol Figure3)
A line chart titled 'Tramadol Hydrochloride Extended-Release Tablets Study 023 WOMAC Pain Responder Analysis' showing the percent of patients achieving various response thresholds. The x-axis measures response threshold as percent improvement from baseline (0 to 100%), and the y-axis indicates the percent of patients achieving response (0 to 60%). The chart compares response rates for multiple doses of tramadol hydrochloride extended-release tablets (100 mg, 200 mg, 300 mg, 400 mg) and placebo.*
FDA Label Image

Tramadol-figure4 (Tramadol Figure4)

Tramadol-figure4 (Tramadol Figure4)
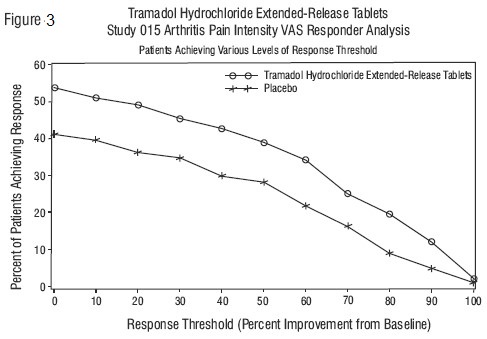
A line graph titled 'Tramadol Hydrochloride Extended-Release Tablets Study 015 Arthritis Pain Intensity VAS Responder Analysis' showing percent of patients achieving response by response threshold (percent improvement from baseline). Two lines compare Tramadol Hydrochloride Extended-Release Tablets and placebo, illustrating patient response proportions across various improvement levels.*
FDA Label Image

Tramadol-structure (Tramadol Structure)

Tramadol-structure (Tramadol Structure)
Chemical structure diagram of tramadol hydrochloride, showing the molecular arrangement including a methoxy group, hydroxyl group, cyclohexane ring, and dimethylaminoethyl side chain with the hydrochloride indicated.*

* About these descriptions: Image descriptions on this page are generated by automated AI analysis of the product label images from the manufacturer's FDA label submission (SPL). They are provided for reference only and may contain errors or omissions. Always rely on the printed label itself and the official FDA labeling, and consult a pharmacist or healthcare professional with any questions about this product.