Figure 1 (Image 01)
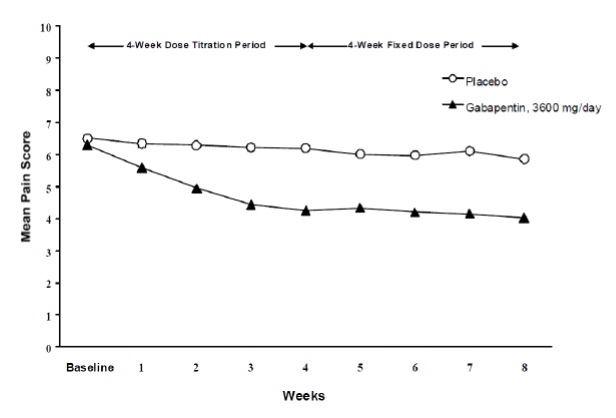
This is a chart displaying the mean pain score for a study evaluating the effectiveness of two treatments for pain: a fixed dose of a drug called Parkod and a high dose of Gabapentin at 3600 mg/day. The chart shows data for a baseline period and four weeks of treatment. The mean pain score for each treatment is reported as 0 for the baseline period and is depicted graphically for each week of treatment.*