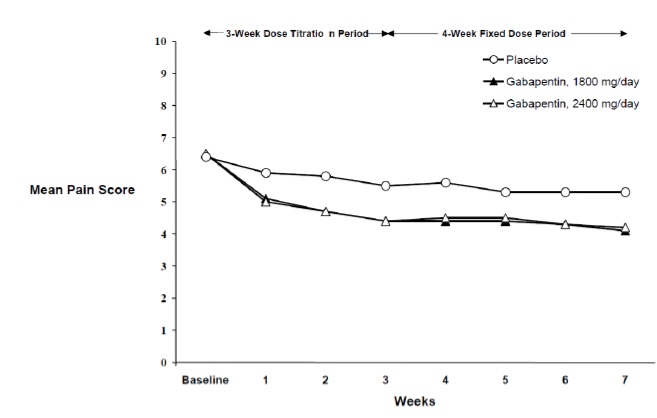
Gabapentin Capsule
Product Images NDC 63629-8486

View Photos of Packaging, Regulatory Labels, and Product Appearance

Product Visual Gallery

This gallery contains 7 technical images submitted to the FDA as part of the official labeling for Gabapentin (NDC 63629-8486). Unlike standard consumer photos, these assets often include clinical data figures, molecular chemical structures, and official manufacturer packaging layouts.

As provided by Bryant Ranch Prepack, these visuals offer a comprehensive scientific overview of the product's physical and chemical identity, aiding pharmacists and researchers in product verification and study.

FDA Label Image

Figure 1 (Image 01)

Figure 1 (Image 01)
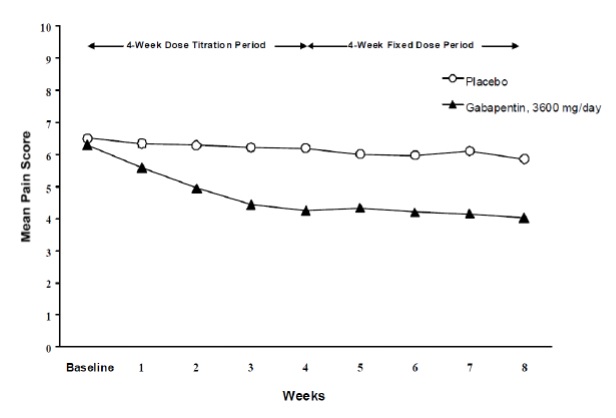
This is a clinical study report containing information on Mean Pain Score for a certain treatment group. The treatment groups include a placebo group and a group that received a certain dose of gabapentin per day. The study indicates that the dose was either titrated or fixed, but it's not clearly mentioned which group had which titration method. The Mean Pain Score was measured at baseline and after several weeks of treatment. However, the exact duration of the study is not mentioned clearly.*
FDA Label Image

Figure 2 (Image 02)

Figure 2 (Image 02)
This is a graph displaying the mean pain score over a 4-week fixed dose period of either a placebo or Gabapentin at 1800mg/day or 2400mg/day. The X-axis represents the weeks, while the Y-axis represents the pain score.*
FDA Label Image

Figure 3 (Image 03)

FDA Label Image

Cockcroft And Gault Equation (Image 04)

FDA Label Image

Gabapentin Structural Formula (Image 05)

FDA Label Image

Image-09 (Image 09)

FDA Label Image

Label (Lbl636298486)

* These product label images have been analyzed using experimental machine learning. Please verify findings with the primary label text.