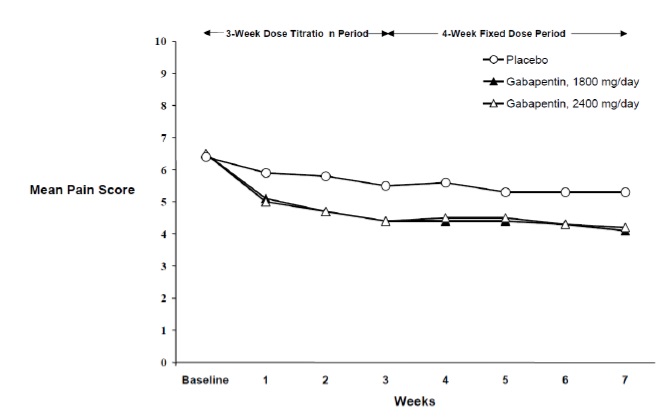
Figure 1 (Image 01)
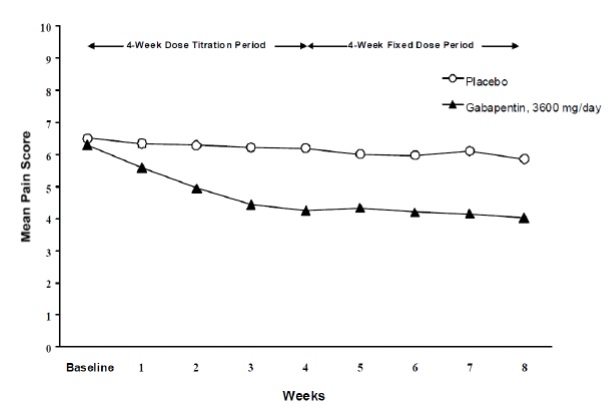
This appears to be a table or graph displaying pain scores for different treatment options over the course of several weeks. The treatments include a placebo and a drug called Gabapentin at a high dose of 3600mg/day. The table may be tracking changes in pain score over time and comparing the effectiveness of the two treatments. Not much context is given so further interpretation is not possible.*