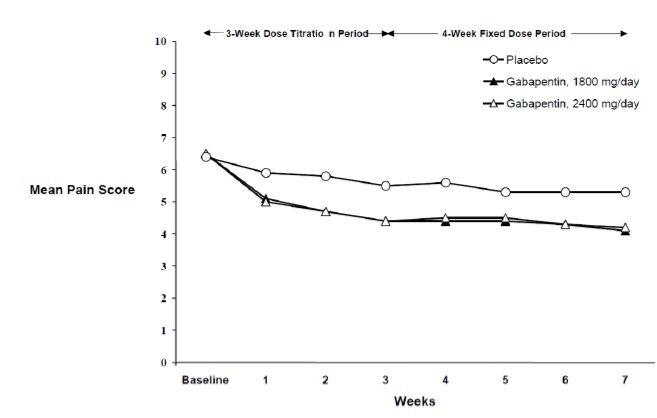
Figure 1 (Image 01)
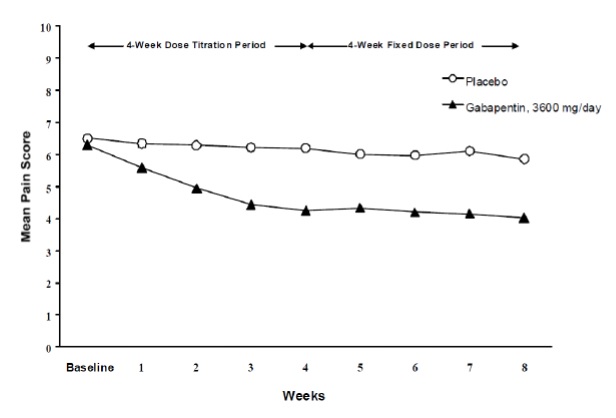
The text describes a chart or a table that compares the mean pain score for a drug called "Gabapentin" in two different dosing treatments. There is also a placebo treatment group included. The two dosing treatments mentioned are "work dose titration period" and "fixed dose period" which have been conducted for four weeks each. The chart or table includes data for pain scores before treatment and at the end of each treatment period for a total of eight weeks. Therefore, the chart or table represents the efficacy of Gabapentin in reducing pain compared to a placebo group.*