Figure1 (Figure1)
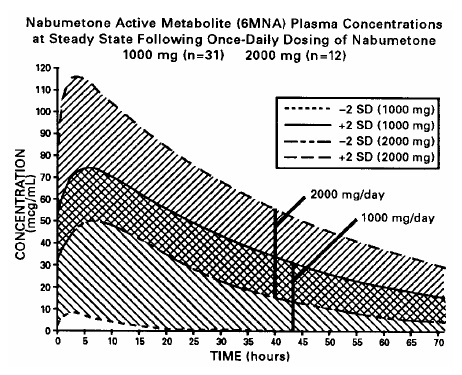
This is a chart showing the plasma concentrations of Nabumetone's active metabolite (BMNA) at steady state in participants who were given 1000mg or 2000mg of Nabumetone once daily. The chart represents 31 participants who took 1000mg/day and 12 participants who took 2000mg/day. The X-axis represents time in hours and the Y-axis represents BMNA plasma concentrations.*


