Cinacalcet Tablet, Film Coated
Product Images NDC 63629-8763

6 FDA label images from Bryant Ranch Prepack · Packaging, Regulatory Labels, and Product Appearance

Product Visual Gallery

This gallery contains 6 technical images submitted to the FDA as part of the official labeling for Cinacalcet (NDC 63629-8763). Unlike standard consumer photos, these assets often include clinical data figures, molecular chemical structures, and official manufacturer packaging layouts.

As provided by Bryant Ranch Prepack, these visuals offer a comprehensive scientific overview of the product's physical and chemical identity, aiding pharmacists and researchers in product verification and study.

FDA Label Image

Cinacalcet-str (Cinacalcet Str)

Cinacalcet-str (Cinacalcet Str)
Chemical structure of the active ingredient Cinacalcet hydrochloride, depicted as a skeletal formula showing its molecular framework including trifluoromethyl, phenyl, and amine groups.*
FDA Label Image

Cinacalcet-figure-1.jpg (Cinacalcet Figure 1)

Cinacalcet-figure-1.jpg (Cinacalcet Figure 1)
A line graph titled 'Mean (SE) iPTH Values (Pooled Phase 3 Studies)' comparing iPTH levels (pg/mL) over 26 weeks between a placebo group and a Cinacalcet group. The Cinacalcet group shows a decreasing trend in iPTH values, while the placebo group's values remain relatively stable. Error bars indicating standard error are shown for each data point.*
FDA Label Image

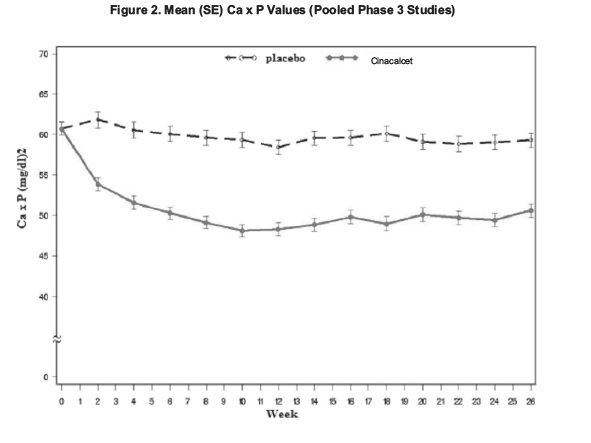
Cinacalcet-figure-2 (Cinacalcet Figure 2)

Cinacalcet-figure-2 (Cinacalcet Figure 2)
A line graph titled 'Mean (SE) Ca x P Values (Pooled Phase 3 Studies)' showing calcium-phosphorus product levels (mg/dL) on the y-axis over 26 weeks on the x-axis. Two lines represent placebo (dashed) and Cinacalcet (solid). The graph illustrates a decreasing trend in Ca x P values for Cinacalcet compared to relatively stable values for placebo over the study period.*
FDA Label Image

Cinacalcet-fig3 (Cinacalcet Fig3)

Cinacalcet-fig3 (Cinacalcet Fig3)
A line graph depicting calcium levels (mg/dL) over time in weeks, with data points marked by circles and error bars. The x-axis spans from baseline (B) through 80 weeks, divided into titration and maintenance phases. The number of subjects (n) decreases over time, indicated below the x-axis. This chart shows the trend of calcium levels in patients with parathyroid carcinoma.*
FDA Label Image

Cinacalcet-fig4.jpg (Cinacalcet Fig4)

Cinacalcet-fig4.jpg (Cinacalcet Fig4)
A line graph depicting serum calcium levels (mg/dL) over time (weeks) in patients treated with Cinacalcet. The x-axis shows weeks from baseline through titration and maintenance phases, while the y-axis indicates calcium concentration. Data points show changes and variability in calcium levels over up to 80 weeks of treatment.*
FDA Label Image

Label (Lbl636298763)

Label (Lbl636298763)
Label for Cinacalcet 30 mg film-coated tablets by Bryant Ranch Prepack. The label includes the product name, strength, NDC 63629-8763-1, and package count of 30 tablets. Storage instructions and manufacturer details are also noted, along with a barcode and BRP Pharmaceuticals logo.*

* About these descriptions: Image descriptions on this page are generated by automated AI analysis of the product label images from the manufacturer's FDA label submission (SPL). They are provided for reference only and may contain errors or omissions. Always rely on the printed label itself and the official FDA labeling, and consult a pharmacist or healthcare professional with any questions about this product.