Fluticasone Propionate And Salmeterol Powder, Metered
Product Images NDC 63629-8809

22 FDA label images from Bryant Ranch Prepack · Packaging, Regulatory Labels, and Product Appearance

Product Visual Gallery

This gallery contains 22 technical images submitted to the FDA as part of the official labeling for Fluticasone Propionate And Salmeterol (NDC 63629-8809). Unlike standard consumer photos, these assets often include clinical data figures, molecular chemical structures, and official manufacturer packaging layouts.

As provided by Bryant Ranch Prepack, these visuals offer a comprehensive scientific overview of the product's physical and chemical identity, aiding pharmacists and researchers in product verification and study.

FDA Label Image

Fp Chem Structure (Fluticasone Propionate Salmeterol Inhalation Powde 1)

Fp Chem Structure (Fluticasone Propionate Salmeterol Inhalation Powde 1)
Chemical structure diagram of the active ingredient Fluticasone Propionate showing elemental bonds and molecular configuration in a black and white format.*
FDA Label Image

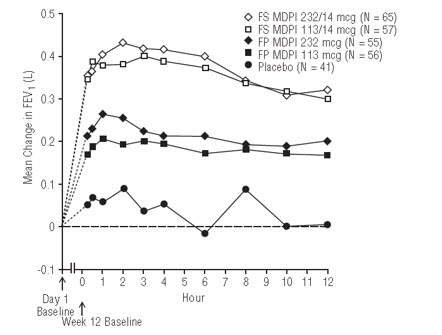
Figure 8 (Fluticasone Propionate Salmeterol Inhalation Powde 10)

Figure 8 (Fluticasone Propionate Salmeterol Inhalation Powde 10)
A line graph showing mean change in FEV1 over 12 hours comparing different doses of Fluticasone Propionate and Salmeterol Metered Dose Inhalers (MDPI) and placebo. Curves represent FS MDPI 232/14 mcg, FP MDPI 232 mcg, FP MDPI 113 mcg, and placebo groups, with data points at various hourly intervals from baseline on day 1 and week 12 baseline.*
FDA Label Image

Teva Logo (Fluticasone Propionate Salmeterol Inhalation Powde 11)

FDA Label Image

Teva Logo (Fluticasone Propionate Salmeterol Inhalation Powde 12)

FDA Label Image

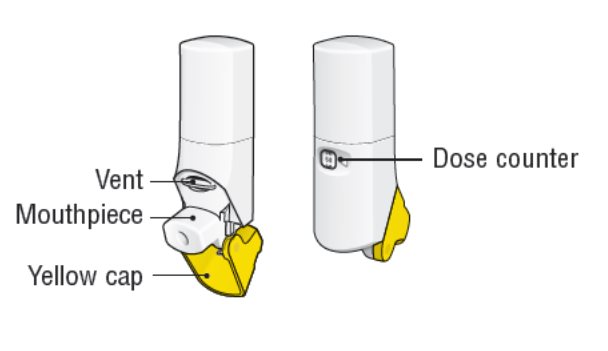
Figurr A (Fluticasone Propionate Salmeterol Inhalation Powde 13)

Figurr A (Fluticasone Propionate Salmeterol Inhalation Powde 13)
An illustration showing two views of a metered powder inhaler labeled as Fluticasone Propionate and Salmeterol. Key parts indicated include the vent, mouthpiece, yellow cap, and dose counter.*
FDA Label Image

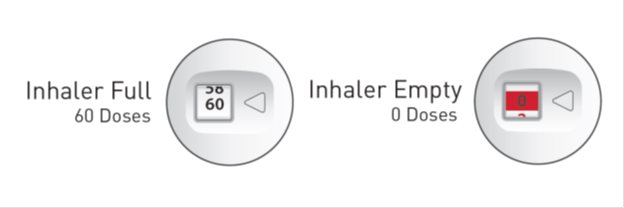
Figure B (Fluticasone Propionate Salmeterol Inhalation Powde 14)

Figure B (Fluticasone Propionate Salmeterol Inhalation Powde 14)
An illustration showing dose indicators on an inhaler for Fluticasone Propionate and Salmeterol metered powder respiratory inhalation. The image depicts two circular views: one labeled 'Inhaler Full' showing 60 doses remaining, and another labeled 'Inhaler Empty' showing 0 doses remaining with a red indicator.*
FDA Label Image

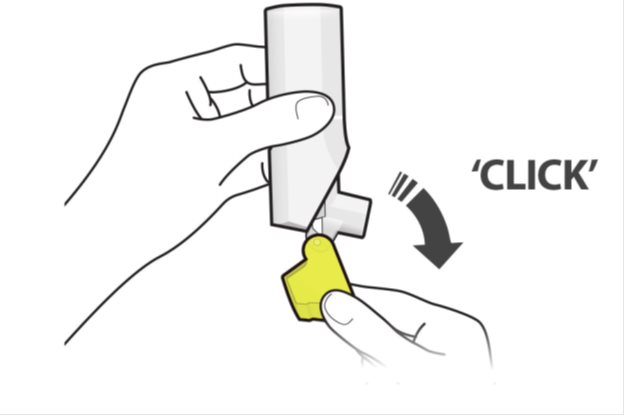
Figure C (Fluticasone Propionate Salmeterol Inhalation Powde 15)

Figure C (Fluticasone Propionate Salmeterol Inhalation Powde 15)
An instructional illustration showing the proper alignment and attachment of the yellow inhaler mouthpiece cover to the inhaler device. The image highlights the motion of snapping the cover into place with a 'click' sound indicated, demonstrating part of the inhaler preparation process for the powder metered respiratory drug Fluticasone Propionate and Salmeterol.*
FDA Label Image

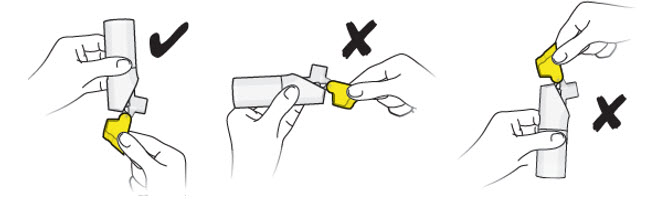
Figure C (Fluticasone Propionate Salmeterol Inhalation Powde 16)

Figure C (Fluticasone Propionate Salmeterol Inhalation Powde 16)
Instructional illustration for Fluticasone Propionate and Salmeterol powder inhaler showing proper use: the first image shows a correct method of inserting a yellow component into the inhaler by holding the inhaler upright. The second and third images show incorrect methods, including inserting the yellow part at an angled or sideways orientation. The diagram emphasizes correct insertion technique for proper inhaler assembly.*
FDA Label Image

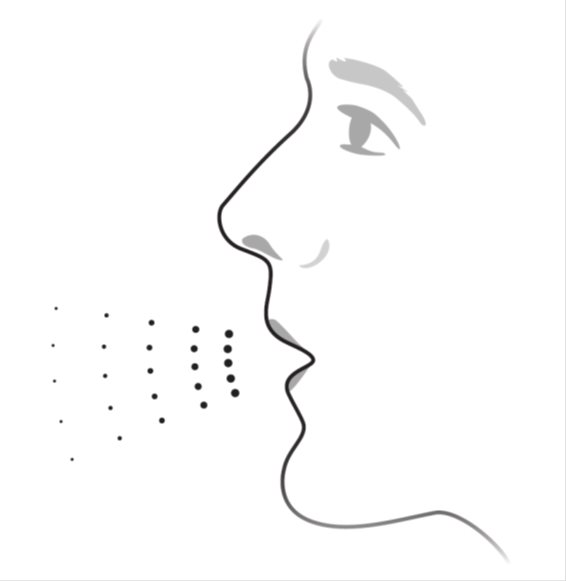
Breathe Out Image (Fluticasone Propionate Salmeterol Inhalation Powde 17)

Breathe Out Image (Fluticasone Propionate Salmeterol Inhalation Powde 17)
An illustration showing a side profile of a human face with dots representing vapor or aerosol being exhaled from the mouth, likely demonstrating the act of inhalation or exhalation for a respiratory powder inhalation product.*
FDA Label Image

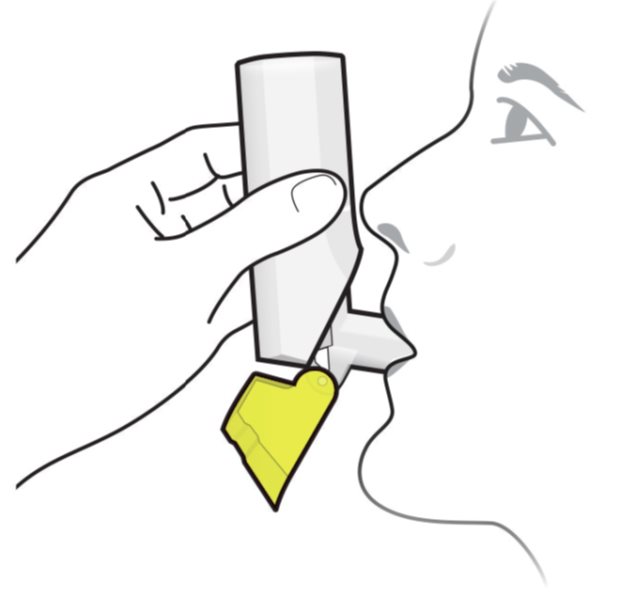
Figure F (Fluticasone Propionate Salmeterol Inhalation Powde 18)

Figure F (Fluticasone Propionate Salmeterol Inhalation Powde 18)
An instructional diagram showing a person holding a metered powder inhaler device near their mouth, demonstrating how to position the inhaler for respiratory inhalation use.*
FDA Label Image

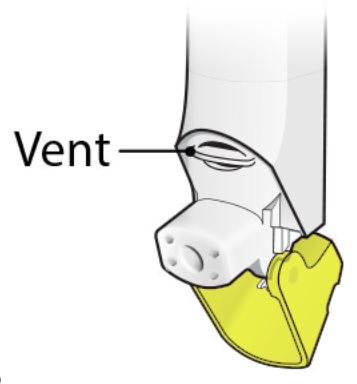
Figure G (Fluticasone Propionate Salmeterol Inhalation Powde 19)

Figure G (Fluticasone Propionate Salmeterol Inhalation Powde 19)
An instructional illustration showing a close-up of a respiratory inhaler device with a focus on the vent area. The vent is labeled and highlighted, indicating a key component of the inhaler mechanism involved in delivering the powdered medication.*
FDA Label Image

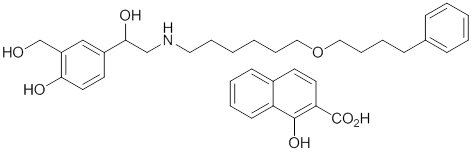
Salmeterol Chem Structure (Fluticasone Propionate Salmeterol Inhalation Powde 2)

Salmeterol Chem Structure (Fluticasone Propionate Salmeterol Inhalation Powde 2)
Chemical structure of Fluticasone Propionate and Salmeterol displayed as a two-part molecular diagram showing the connected atoms and functional groups characteristic of these compounds.*
FDA Label Image

Figure H (Fluticasone Propionate Salmeterol Inhalation Powde 20)

Figure H (Fluticasone Propionate Salmeterol Inhalation Powde 20)
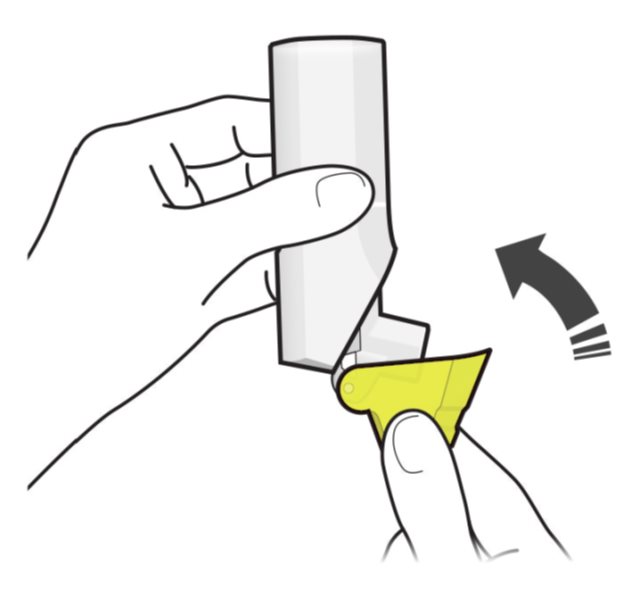
An instructional illustration showing two hands operating an inhaler device. One hand holds the main body of the inhaler, while the other hand is shown lifting or removing a yellow protective cap from the mouthpiece, indicated by an arrow pointing upward and away from the inhaler.*
FDA Label Image

Teva Logo (Fluticasone Propionate Salmeterol Inhalation Powde 21)

FDA Label Image

Figure 1 (Fluticasone Propionate Salmeterol Inhalation Powde 3)

Figure 1 (Fluticasone Propionate Salmeterol Inhalation Powde 3)
A clinical trial comparison chart showing difference from placebo with 95% confidence intervals for various doses of fluticasone propionate delivered by two inhaler types: metered dose inhaler (MDPI) and dry powder inhaler (DPI). Data is separated into Trial 201 and Trial 202, with treatment doses in micrograms (mcg) displayed along the x-axis and the difference from placebo on the y-axis.*
FDA Label Image

Figure 2 (Fluticasone Propionate Salmeterol Inhalation Powde 4)

Figure 2 (Fluticasone Propionate Salmeterol Inhalation Powde 4)
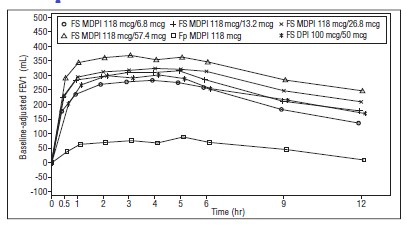
A line graph displaying baseline-adjusted FEV1 (mL) over time (hours) following administration of various doses and formulations of Fluticasone Propionate and Salmeterol. The graph compares multiple dosage regimens showing changes in lung function from 0 to 12 hours post-dose.*
FDA Label Image

Figure 3 (Fluticasone Propionate Salmeterol Inhalation Powde 5)

Figure 3 (Fluticasone Propionate Salmeterol Inhalation Powde 5)
Line graph showing mean change in FEV1 (L) over 12 weeks for different dosages of Fluticasone Propionate and Salmeterol delivered via metered dose inhalers (MDPI), compared to placebo. The chart includes treatment groups FS MDPI 113 mcg/14 mcg, FS MDPI 55 mcg/14 mcg, FP MDPI 113 mcg, FP MDPI 55 mcg, and placebo, with sample sizes noted for each time point.*
FDA Label Image

Figure 4 (Fluticasone Propionate Salmeterol Inhalation Powde 6)

Figure 4 (Fluticasone Propionate Salmeterol Inhalation Powde 6)
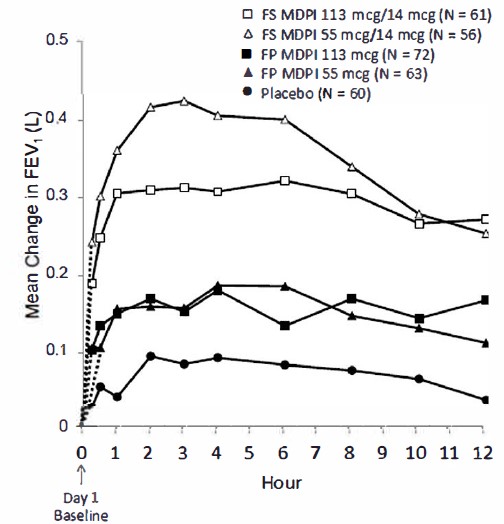
A line graph showing mean change in FEV1 (L) over 12 hours following inhalation on Day 1 baseline. The graph compares FS MDPI at 113 mcg/14 mcg and 55 mcg/14 mcg, FP MDPI at 113 mcg and 55 mcg, and placebo, with mean changes plotted from 0 to 0.5 liters over time.*
FDA Label Image

Figure 5 (Fluticasone Propionate Salmeterol Inhalation Powde 7)

Figure 5 (Fluticasone Propionate Salmeterol Inhalation Powde 7)
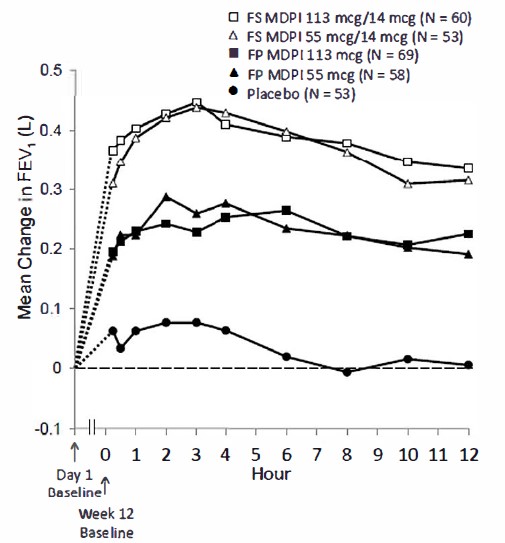
A line chart depicting the mean change in FEV1 (L) over 12 hours comparing different formulations: FS MDPI 113 mcg/14 mcg, FS MDPI 55 mcg/14 mcg, FP MDPI 113 mcg, FP MDPI 55 mcg, and placebo. The x-axis shows time in hours post-dose, and the y-axis shows mean change in FEV1 from baseline measured at Day 1 and Week 12.*
FDA Label Image

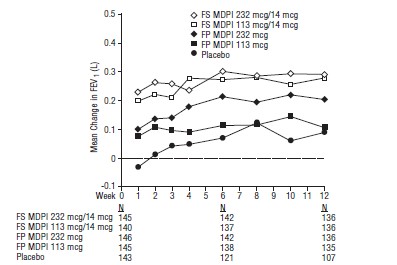
Figure 6 (Fluticasone Propionate Salmeterol Inhalation Powde 8)

Figure 6 (Fluticasone Propionate Salmeterol Inhalation Powde 8)
A line graph depicting mean change in FEV1 (liters) over 12 weeks with different treatments: FS MDPI 232 mcg/14 mcg, FS MDPI 113 mcg/14 mcg, FP MDPI 232 mcg, FP MDPI 113 mcg, and placebo. The x-axis shows weeks 0 to 12, and the y-axis shows mean change in FEV1 from -0.1 to 0.5 liters. Sample sizes per week per group are provided below the graph.*
FDA Label Image

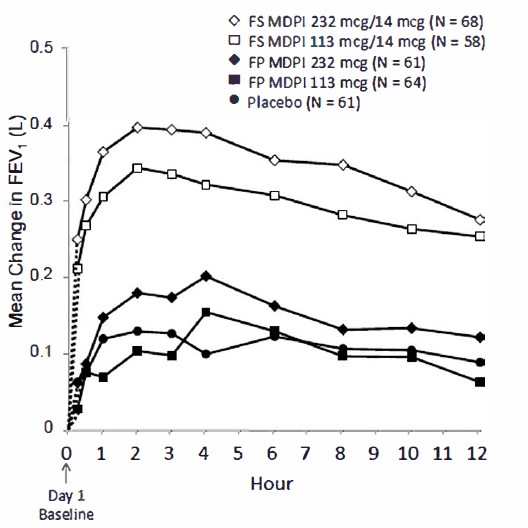
Figure 7 (Fluticasone Propionate Salmeterol Inhalation Powde 9)

Figure 7 (Fluticasone Propionate Salmeterol Inhalation Powde 9)
A line graph depicting mean change in FEV1 (Liters) over 12 hours from baseline on Day 1, comparing different doses of Fluticasone Propionate and Salmeterol Metered Dose Powder Inhalers (MDPI) and Placebo. The treatments include FS MDPI 232 mcg/14 mcg, FS MDPI 113 mcg/14 mcg, FP MDPI 232 mcg, FP MDPI 113 mcg, and Placebo, with each line representing mean FEV1 changes in respective groups.*
FDA Label Image

Label (Lbl636298809)

Label (Lbl636298809)
Label for Fluticasone Propionate and Salmeterol inhalation powder, metered powder dosage form. The label shows strengths of 113 mcg fluticasone propionate and 14 mcg salmeterol per dose, with 60 metered inhalations (0.45 g) in the package. It is labeled by Bryant Ranch Prepack, includes storage instructions, and states Rx only.*

* About these descriptions: Image descriptions on this page are generated by automated AI analysis of the product label images from the manufacturer's FDA label submission (SPL). They are provided for reference only and may contain errors or omissions. Always rely on the printed label itself and the official FDA labeling, and consult a pharmacist or healthcare professional with any questions about this product.