Fluticasone Propionate And Salmeterol Powder, Metered
Product Images NDC 63629-8810

View Photos of Packaging, Regulatory Labels, and Product Appearance

Product Visual Gallery

This gallery contains 22 technical images submitted to the FDA as part of the official labeling for Fluticasone Propionate And Salmeterol (NDC 63629-8810). Unlike standard consumer photos, these assets often include clinical data figures, molecular chemical structures, and official manufacturer packaging layouts.

As provided by Bryant Ranch Prepack, these visuals offer a comprehensive scientific overview of the product's physical and chemical identity, aiding pharmacists and researchers in product verification and study.

FDA Label Image

Fp Chem Structure (Fluticasone Propionate Salmeterol Inhalation Powde 1)

Fp Chem Structure (Fluticasone Propionate Salmeterol Inhalation Powde 1)
Chemical structure diagram of fluticasone propionate, showing its detailed molecular framework with carbon, hydrogen, oxygen, sulfur, and fluorine atoms represented by lines and letters.*
FDA Label Image

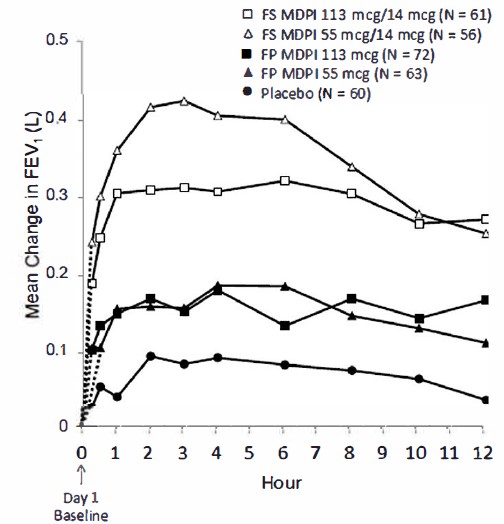
Figure 8 (Fluticasone Propionate Salmeterol Inhalation Powde 10)

Figure 8 (Fluticasone Propionate Salmeterol Inhalation Powde 10)
A line graph depicting mean change in FEV1 over time for different groups using Fluticasone Propionate and Salmeterol metered doses and placebo. The x-axis represents time in hours from baseline to 12 hours, and the y-axis shows mean change in FEV1. Multiple lines correspond to varying dosages and placebo responses in a clinical trial setting.*
FDA Label Image

Teva Logo (Fluticasone Propionate Salmeterol Inhalation Powde 11)

FDA Label Image

Teva Logo (Fluticasone Propionate Salmeterol Inhalation Powde 12)

FDA Label Image

Figurr A (Fluticasone Propionate Salmeterol Inhalation Powde 13)

Figurr A (Fluticasone Propionate Salmeterol Inhalation Powde 13)
Illustration of a metered powder inhaler device for Fluticasone Propionate and Salmeterol. The diagram labels key features including the mouthpiece, a yellow protective cap, a vent, and a dose counter on the device body.*
FDA Label Image

Figure B (Fluticasone Propionate Salmeterol Inhalation Powde 14)

Figure B (Fluticasone Propionate Salmeterol Inhalation Powde 14)
An illustration showing the dose counter window of an inhaler. One view displays "Inhaler Full" with 60 doses remaining, and the other shows "Inhaler Empty" with 0 doses left, indicating when the inhaler is empty and no doses remain.*
FDA Label Image

Figure C (Fluticasone Propionate Salmeterol Inhalation Powde 15)

Figure C (Fluticasone Propionate Salmeterol Inhalation Powde 15)
An instructional illustration showing how to load the yellow mouthpiece cover onto a powder metered inhaler by pressing it until it clicks. The hands demonstrate the proper placement and attachment of the cover onto the inhaler for Fluticasone Propionate and Salmeterol powder inhalation.*
FDA Label Image

Figure C (Fluticasone Propionate Salmeterol Inhalation Powde 16)

Figure C (Fluticasone Propionate Salmeterol Inhalation Powde 16)
An instructional illustration demonstrating correct and incorrect ways to insert a yellow component into a respiratory inhaler device. The first panel shows a correct method with a checkmark, while the second and third panels depict incorrect methods with crosses.*
FDA Label Image

Breathe Out Image (Fluticasone Propionate Salmeterol Inhalation Powde 17)

Breathe Out Image (Fluticasone Propionate Salmeterol Inhalation Powde 17)
A simple black and white illustration showing the side profile of a human face with dots emanating from the mouth, suggesting inhalation or aerosol spray. There are no product names or text visible in the image.*
FDA Label Image

Figure F (Fluticasone Propionate Salmeterol Inhalation Powde 18)

Figure F (Fluticasone Propionate Salmeterol Inhalation Powde 18)
Illustration showing a person using a metered-dose inhaler with a spacer device. The drawing demonstrates how to hold the inhaler and position the mouthpiece for respiratory inhalation.*
FDA Label Image

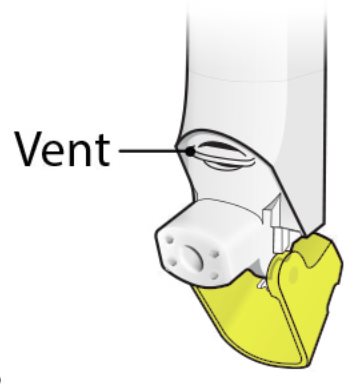
Figure G (Fluticasone Propionate Salmeterol Inhalation Powde 19)

Figure G (Fluticasone Propionate Salmeterol Inhalation Powde 19)
Illustration showing a close-up view of a metered dose inhaler mouthpiece with a labeled vent, highlighting the part of the device where air passes through during inhalation. The image focuses on the inhaler design relevant to respiratory drug delivery.*
FDA Label Image

Salmeterol Chem Structure (Fluticasone Propionate Salmeterol Inhalation Powde 2)

Salmeterol Chem Structure (Fluticasone Propionate Salmeterol Inhalation Powde 2)
Chemical structure of Fluticasone Propionate and Salmeterol, the active ingredients in this respiratory inhalation powder medication. The diagram depicts the molecular arrangement and bonds of the combined compounds.*
FDA Label Image

Figure H (Fluticasone Propionate Salmeterol Inhalation Powde 20)

Figure H (Fluticasone Propionate Salmeterol Inhalation Powde 20)
An instructional illustration showing hands holding a metered dose inhaler with a protective cap. One hand holds the inhaler upright while the other hand removes the yellow cap by lifting it off with an arrow indicating the motion direction. The image demonstrates how to prepare the inhaler for use.*
FDA Label Image

Teva Logo (Fluticasone Propionate Salmeterol Inhalation Powde 21)

FDA Label Image

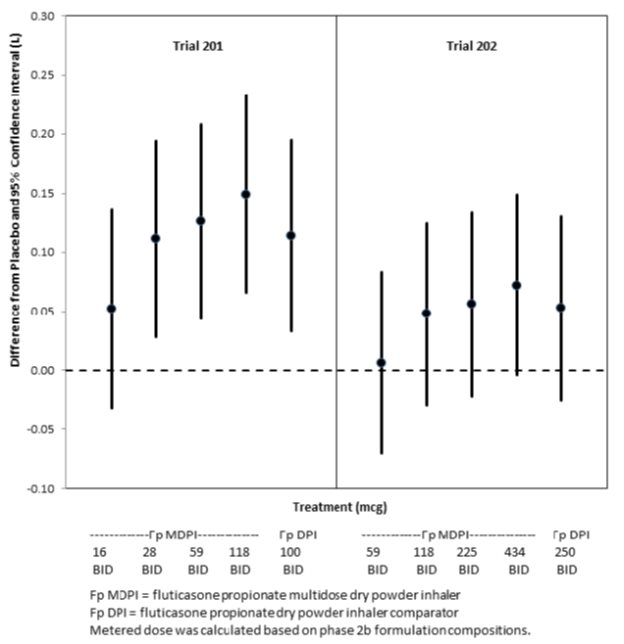
Figure 1 (Fluticasone Propionate Salmeterol Inhalation Powde 3)

Figure 1 (Fluticasone Propionate Salmeterol Inhalation Powde 3)
A chart showing the difference from placebo with 95% confidence intervals for two clinical trials (Trial 201 and Trial 202) of fluticasone propionate and salmeterol respiratory inhalation powder doses measured in micrograms (mcg). The x-axis displays various metered doses given twice daily, and the y-axis shows the numerical difference from placebo with error bars representing confidence intervals. Two inhaler types are compared: fluticasone propionate multidose dry powder inhaler (Fp MDPI) and fluticasone propionate dry powder inhaler comparator (Fp DPI).*
FDA Label Image

Figure 2 (Fluticasone Propionate Salmeterol Inhalation Powde 4)

Figure 2 (Fluticasone Propionate Salmeterol Inhalation Powde 4)
A line graph showing baseline-adjusted FEV1 (mL) plotted against time (hours) up to 12 hours for various doses and forms of fluticasone propionate and salmeterol dry powders, illustrating changes in lung function over time.*
FDA Label Image

Figure 3 (Fluticasone Propionate Salmeterol Inhalation Powde 5)

Figure 3 (Fluticasone Propionate Salmeterol Inhalation Powde 5)
A line graph showing mean change in FEV1 (L) over 12 weeks for different treatment groups, including FS MDPI 113 mcg/14 mcg, FS MDPI 55 mcg/14 mcg, FP MDPI 113 mcg, FP MDPI 55 mcg, and placebo. A table below the graph lists sample sizes for each group at various time points.*
FDA Label Image

Figure 4 (Fluticasone Propionate Salmeterol Inhalation Powde 6)

Figure 4 (Fluticasone Propionate Salmeterol Inhalation Powde 6)
A line graph showing mean change in FEV1 (L) over 12 hours from baseline on Day 1 for different treatment groups: FS MDPI 113 mcg/14 mcg, FS MDPI 55 mcg/14 mcg, FP MDPI 113 mcg, FP MDPI 55 mcg, and placebo. The y-axis represents mean change in FEV1 in liters, and the x-axis shows time in hours from 0 to 12.*
FDA Label Image

Figure 5 (Fluticasone Propionate Salmeterol Inhalation Powde 7)

Figure 5 (Fluticasone Propionate Salmeterol Inhalation Powde 7)
A line graph showing mean change in FEV1 (L) over 12 hours at Week 12 baseline. The graph compares effects of Fluticasone Propionate and Salmeterol Metered Dose Inhaler (FS MDPI) at 113 mcg/14 mcg and 55 mcg/14 mcg doses, Fluticasone Propionate Metered Dose Inhaler (FP MDPI) at 113 mcg and 55 mcg doses, and placebo. The vertical axis represents mean change in FEV1 (L), and the horizontal axis represents time in hours. FS MDPI groups show the highest mean change over time compared to FP MDPI and placebo.*
FDA Label Image

Figure 6 (Fluticasone Propionate Salmeterol Inhalation Powde 8)

Figure 6 (Fluticasone Propionate Salmeterol Inhalation Powde 8)
A line graph showing the mean change in FEV1 (L) over 12 weeks for different treatment groups: FS MDPI 232 mcg/14 mcg, FS MDPI 113 mcg/14 mcg, FP MDPI 232 mcg, FP MDPI 113 mcg, and Placebo. The x-axis represents weeks 0 to 12, and the y-axis represents mean change in FEV1 ranging from -0.1 to 0.5 liters. The graph includes a legend and sample sizes for each group at various time points along the x-axis.*
FDA Label Image

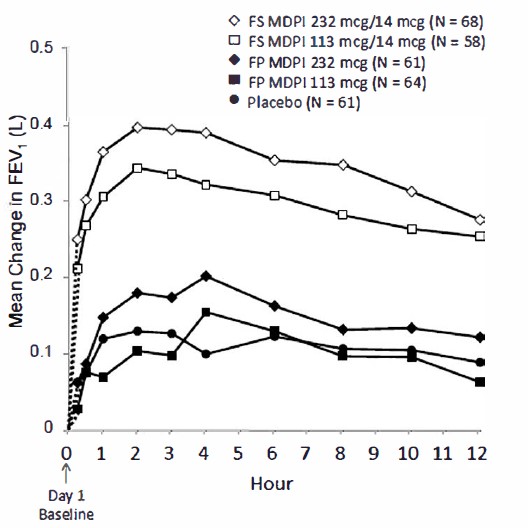
Figure 7 (Fluticasone Propionate Salmeterol Inhalation Powde 9)

Figure 7 (Fluticasone Propionate Salmeterol Inhalation Powde 9)
A line graph showing mean change in FEV1 (L) over 12 hours from baseline (Day 1) for various groups: FS MDI 232 mcg/14 mcg, FS MDI 113 mcg/14 mcg, FP MDI 232 mcg, FP MDI 113 mcg, and placebo. The vertical axis represents mean change in FEV1, and the horizontal axis represents hours post-dose up to 12 hours.*
FDA Label Image

Label (Lbl636298810)

Label (Lbl636298810)
Label for Fluticasone Propionate and Salmeterol Inhalation Powder, metered powder dosage form by Bryant Ranch Prepack. Shows active ingredient strengths as 232 mcg fluticasone propionate and 14 mcg salmeterol per dose. Packaging indicates 60 metered inhalations (0.45 g) and includes storage instructions and warnings. NDC 63629-8810-1 is displayed. The label includes a barcode and the BRP Pharmaceuticals logo.*

* About these descriptions: Image descriptions on this page are generated by automated AI analysis of the product label images from the manufacturer's FDA label submission (SPL). They are provided for reference only and may contain errors or omissions. Always rely on the printed label itself and the official FDA labeling, and consult a pharmacist or healthcare professional with any questions about this product.