Alfuzosin Hydrochloride Tablet, Extended Release
Product Images NDC 63629-9155

11 FDA label images from Bryant Ranch Prepack · Packaging, Regulatory Labels, and Product Appearance

Product Visual Gallery

This gallery contains 11 technical images submitted to the FDA as part of the official labeling for Alfuzosin Hydrochloride (NDC 63629-9155). Unlike standard consumer photos, these assets often include clinical data figures, molecular chemical structures, and official manufacturer packaging layouts.

As provided by Bryant Ranch Prepack, these visuals offer a comprehensive scientific overview of the product's physical and chemical identity, aiding pharmacists and researchers in product verification and study.

FDA Label Image

Molecular Structure (Ef35abcf E0b6 4551 84cf A689ad11e6cd 01)
Molecular Structure (Ef35abcf E0b6 4551 84cf A689ad11e6cd 01)
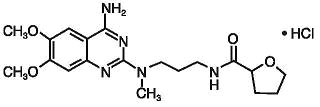
Chemical structure of Alfuzosin hydrochloride showing the molecular arrangement including aromatic rings and functional groups associated with the active ingredient.*
FDA Label Image

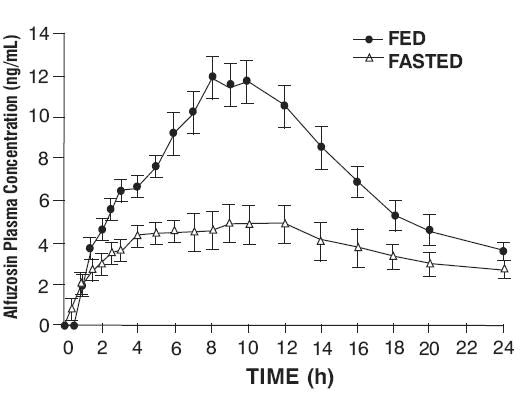
Figure 1 (Ef35abcf E0b6 4551 84cf A689ad11e6cd 02)

Figure 1 (Ef35abcf E0b6 4551 84cf A689ad11e6cd 02)
A pharmacokinetic line graph illustrating Alfuzosin plasma concentration (ng/mL) over time (hours) following oral administration of Alfuzosin hydrochloride 10 mg extended-release tablets. The graph compares plasma levels under fed and fasted conditions, showing higher concentrations and a distinct peak time when fed versus relatively lower and more stable concentrations when fasted, with error bars indicating variability.*
FDA Label Image

Figure 2 (Ef35abcf E0b6 4551 84cf A689ad11e6cd 03)

Figure 2 (Ef35abcf E0b6 4551 84cf A689ad11e6cd 03)
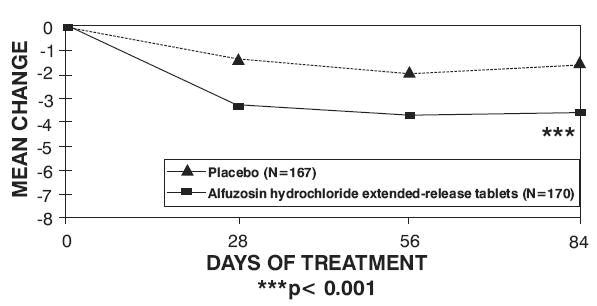
A line graph depicting mean change over days of treatment comparing placebo and Alfuzosin hydrochloride extended-release tablets. The x-axis shows days of treatment (0, 28, 56, 84) and the y-axis shows mean change values. The graph shows a steeper reduction with Alfuzosin hydrochloride compared to placebo, with statistical significance indicated (p < 0.001).*
FDA Label Image

Figure 3 (Ef35abcf E0b6 4551 84cf A689ad11e6cd 04)

Figure 3 (Ef35abcf E0b6 4551 84cf A689ad11e6cd 04)
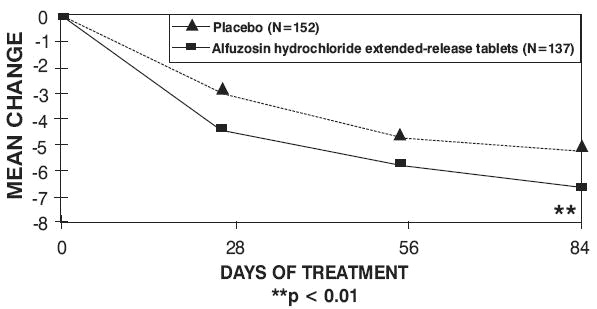
A line graph comparing the mean change over days of treatment (0, 28, 56, 84) between placebo and Alfuzosin hydrochloride extended-release tablets groups. The graph shows two lines: one for placebo (triangles) and one for Alfuzosin hydrochloride extended-release tablets (squares), with the latter showing a greater mean change reduction statistically significant at p < 0.01.*
FDA Label Image

Figure 4 (Ef35abcf E0b6 4551 84cf A689ad11e6cd 05)

Figure 4 (Ef35abcf E0b6 4551 84cf A689ad11e6cd 05)
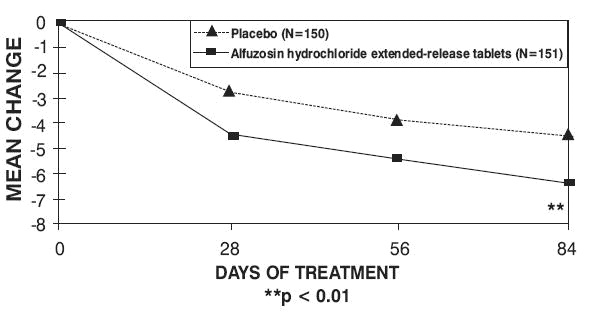
A line graph comparing mean change over days of treatment between placebo and Alfuzosin hydrochloride extended-release tablets. The x-axis shows days of treatment (0, 28, 56, 84), and the y-axis shows mean change values. The graph shows greater negative mean change for Alfuzosin hydrochloride than placebo, with statistical significance indicated at day 84 (p < 0.01).*
FDA Label Image

Figure 5 (Ef35abcf E0b6 4551 84cf A689ad11e6cd 06)

Figure 5 (Ef35abcf E0b6 4551 84cf A689ad11e6cd 06)
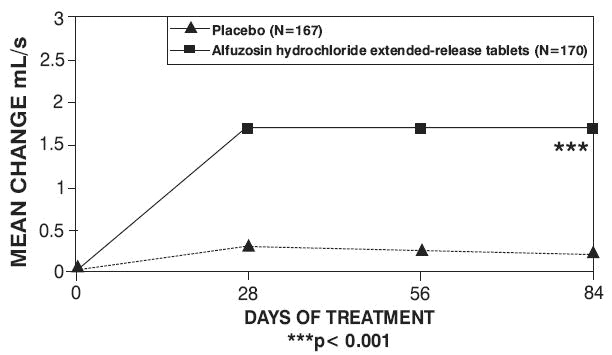
A line graph showing mean change in mL/s over days of treatment (0, 28, 56, 84) comparing placebo (N=167) and Alfuzosin hydrochloride extended-release tablets (N=170). The Alfuzosin group shows an increase around 1.7 mL/s from day 28 to 84, while placebo remains near zero. Statistical significance is indicated at day 84 (p < 0.001).*
FDA Label Image

Figure 6 (Ef35abcf E0b6 4551 84cf A689ad11e6cd 07)

Figure 6 (Ef35abcf E0b6 4551 84cf A689ad11e6cd 07)
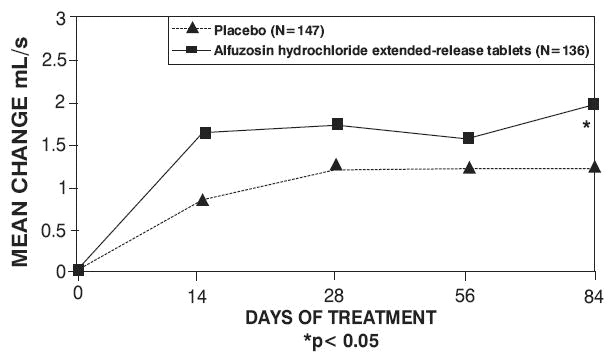
A line graph showing mean change in mL/s over days of treatment comparing placebo (N=147) and Alfuzosin hydrochloride extended-release tablets (N=136). The x-axis represents days of treatment (0, 14, 28, 56, 84) and the y-axis shows mean change in mL/s from 0 to 3. Alfuzosin shows a greater increase than placebo, with a statistically significant difference at day 84 (p < 0.05).*
FDA Label Image

Figure 7 (Ef35abcf E0b6 4551 84cf A689ad11e6cd 08)

Figure 7 (Ef35abcf E0b6 4551 84cf A689ad11e6cd 08)
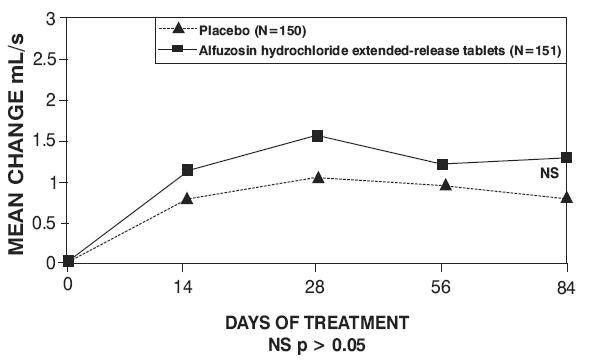
A line graph showing mean change in mL/s over days of treatment for placebo and alfuzosin hydrochloride extended-release tablets. The x-axis represents days of treatment (0, 14, 28, 56, 84), and the y-axis shows mean change in mL/s (0 to 3). Two lines compare placebo (triangles) and alfuzosin hydrochloride extended-release tablets (squares), with data points at each time. The graph notes NS (not significant) with p > 0.05 by day 84.*
FDA Label Image

Company Logo (Ef35abcf E0b6 4551 84cf A689ad11e6cd 09)

FDA Label Image

Company Logo (Ef35abcf E0b6 4551 84cf A689ad11e6cd 10)

FDA Label Image

Label (Lbl636299155)

Label (Lbl636299155)
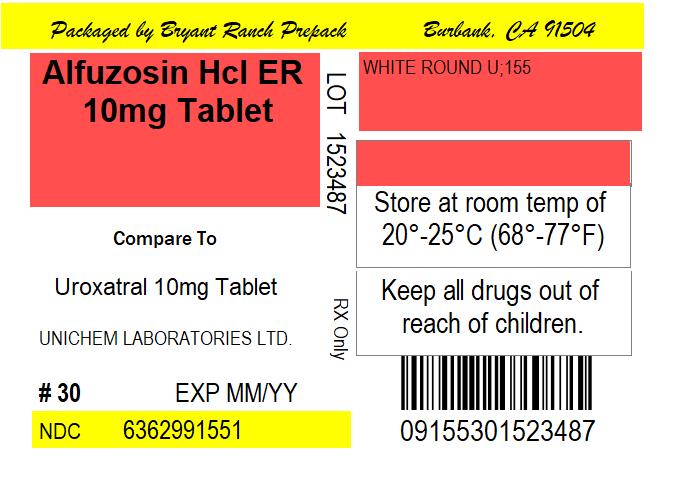
Label for Alfuzosin HCl ER 10 mg Tablet, an extended-release oral tablet packaged by Bryant Ranch Prepack. The label states it is comparable to Uroxatral 10 mg tablet from Unichem Laboratories Ltd, includes storage instructions (20°-25°C), warning to keep out of reach of children, and shows the NDC 63629-9155. The package quantity is 30 tablets.*

* About these descriptions: Image descriptions on this page are generated by automated AI analysis of the product label images from the manufacturer's FDA label submission (SPL). They are provided for reference only and may contain errors or omissions. Always rely on the printed label itself and the official FDA labeling, and consult a pharmacist or healthcare professional with any questions about this product.